Agreement No. CE
63/2016 (EP)
Environmental Monitoring and Audit
for Disposal Facility to the East of Sha Chau (2017-2020) - Investigation
MONTHLY EM&A REPORT FOR October 2017
1.1
Background
1.1.1
The Civil
Engineering and Development Department (CEDD) is managing a number of marine
disposal facilities in Hong Kong waters, including the Contaminated Mud Pits
(CMPs) to the South of The Brothers (SB) and to the East of Sha Chau (ESC) for
the disposal of contaminated sediment, and open-sea disposal grounds located to
the South of Cheung Chau (SCC), East of Tung Lung Chau (ETLC) and East of
Ninepins (ENP) for the disposal of uncontaminated sediment. Two Environmental Permits (EPs),
EP-312/2008/A and EP-427/2011/A, were issued by the Environmental Protection
Department (EPD) to the CEDD, the Permit Holder, on 28 November 2008 and 23
December 2011 for the Dredging, Management and Capping of Contaminated Sediment
Disposal Facilities at ESC CMP V and SB CMPs, respectively.
1.1.2
Under the
requirements of the two EPs
for ESC CMP V and SB CMPs, EM&A programmes which encompass water
and sediment chemistry, fisheries assessment, tissue and whole body analysis,
sediment toxicity and benthic recolonisation studies
as set out in the EM&A Manuals are required to be implemented. EM&A programmes
have been continuously carried out during the operation of the CMPs at ESC and
SB. A review of the
collection and analysis of such environmental data from the monitoring
programme demonstrated that there had not been any adverse environmental
impacts resulting from disposal activities ([1]) ([2]). The current programme will assess the impacts resulting
from dredging, disposal and capping operations of CMP V as well as capping
operations of SB CMPs.
1.1.3
The
present EM&A programme under Agreement No. CE 63/2016 (EP) covers the
dredging, disposal and capping operations of the ESC CMP V as well as the capping
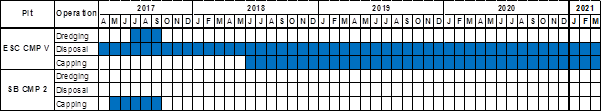
operations of the SB CMPs (see Annex A for the EM&A programme). Detailed works schedule for ESC CMP V and
SB CMPs is shown in Figure
1.1. In October 2017, the following work was
being undertaken:
�P Disposal of contaminated mud at
ESC CMP Vd.
Figure 1.1 Works Schedule
for ESC CMP V and SB
CMPs
1.2
Reporting Period
1.2.1
This Monthly
EM&A Report for
October 2017 covers the EM&A activities for
the reporting month of October 2017.
1.3
Details of Sampling and
Laboratory Testing Activities
1.3.1
The following monitoring
activities were undertaken for ESC CMP V in October 2017:
�P
Pit Specific Sediment Chemistry of ESC CMP Vd was undertaken on 3 October 2017;
�P
Routine Water Quality Monitoring of ESC CMP V was undertaken on 4 October 2017;
�P
Water Column Profiling of ESC CMP Vd was
undertaken on 6 October 2017; and
�P
Sediment Chemistry after a Major
Storm of ESC CMP V was undertaken on 19 October
2017.
1.3.2
No monitoring activities were scheduled to be undertaken for
SB CMPs in October 2017.
1.4
Details of Outstanding Sampling and/or Analysis
1.4.1
No outstanding sampling and analysis remained for
October 2017.
1.5
Brief Discussion of the Monitoring Results for ESC CMP V
1.5.1
Brief discussion of the monitoring
results of the following activities for ESC CMP V is presented in this Monthly
EM&A Report for October 2017:
�P
Water Column Profiling of ESC CMP Vd in October 2017;
�P
Routine Water Quality Monitoring of ESC CMP V in October 2017;
�P
Pit Specific
Sediment Chemistry of ESC CMP Vd
in September and October 2017; and
�P
Sediment Chemistry after a Major
Storm of ESC CMP V in August and October
2017.
1.5.2
Water
Column Profiling of ESC CMP Vd
�V October 2017
1.5.3
Water Column Profiling was undertaken at a total of two sampling stations (Upstream and
Downstream stations) on 6 October 2017.
The monitoring results have been assessed for compliance with the Water Quality Objectives (WQOs) set by Environmental
Protection Department (EPD). This consists of a review of the EPD routine water quality monitoring
data for the wet season period (April to October) of 2006 - 2015 from stations in the Northwestern
Water Control Zone (WCZ), where the ESC CMPs are located ([3]). For Salinity, the averaged value
obtained from the Reference (Upstream) station was used for the basis as the WQO. Levels of Dissolved Oxygen (DO) and Turbidity were also assessed for
compliance with the Action and Limit Levels (see Table B1 of Annex B for details).
In-situ
Measurements
1.5.4
Analyses of results for October 2017 indicated that levels
of DO, Salinity and pH complied with the WQOs at both Downstream and Upstream stations (Table
B2 of Annex
B). In addition, levels of DO at all stations complied with the Action and Limit Levels (Tables
B1 and B2 of Annex B). Levels of
Turbidity at Downstream station exceeded the Action Level, however the exceedances was not considered
as indicating any unacceptable impacts from the disposal operations as disposal
activities were not carried out during the monitoring period on 6 October 2017.
Laboratory
Measurements for Suspended Solids (SS)
1.5.5
Analyses of results for October 2017
indicated that the SS levels were higher than the WQO at Downstream
station. However, both Upstream and
Downstream stations complied with the Action and Limit Levels (Tables
B1 and B2 of Annex
B).
1.5.6
Overall, the monitoring results
indicated that the mud disposal operation at ESC CMP Vd
did not appear to cause any deterioration in water quality during this
reporting period.
1.5.7
Routine
Water Quality Monitoring of ESC CMP V �V October 2017
1.5.8
Routine Water Quality Monitoring of ESC CMP V was undertaken
on 4 October 2017. The monitoring results have been assessed for
compliance with the WQOs (see Section 1.5.3 for details). The monitoring results are shown in Tables B3 and
B4 of Annex B and Figures 1 - 10 of Annex C. A total of
sixteen (16) monitoring stations were sampled in October 2017 as shown in Figure 1.2.
In-situ Measurements
1.5.9
Graphical presentation of the
monitoring results (Temperature, DO, pH, Salinity and Turbidity) is shown in Figures
1 - 6 of Annex C. Analyses of results for October 2017 indicated that the levels of pH,
Salinity and DO complied with the WQOs at all
stations (Impact, Intermediate, Reference and Ma Wan stations) in October 2017 (Table B3 of Annex
B; Figures 1, 3 and 5 of Annex C).
1.5.10
The levels of DO and Turbidity
complied with the Action and Limit Levels at all stations (Table
B3 of Annex
B; Figures 3 and 6 of Annex
C).
1.5.11
Overall, in-situ measurement results of the Routine
Water Quality Monitoring indicated that the disposal
operation at ESC CMP Vd did not appear to cause any
unacceptable impacts in water quality in October 2017.
Laboratory Measurements
1.5.12
Laboratory analysis of October
2017 results indicated that concentrations of Cadmium, Silver and Mercury were
below their limit of reporting at all stations. Arsenic, Chromium, Nickel, Lead, Copper and Zinc were detected in October 2017 samples and the concentrations of these metals and metalloids were similar amongst stations (Table B4 of Annex
B; Figure 7 of Annex
C).
1.5.13
For nutrients, concentrations of
Total Inorganic Nitrogen (TIN) at all stations in October 2017 were higher than the WQO (0.5
mg/L) (Table B4 of Annex B; Figure 8 of Annex C). It should be noted that
due to the effect of Pearl River, the North Western WCZ has historically
experienced higher levels of TIN ([4]). Therefore, the exceedances of TIN WQO at
these stations are unlikely to be caused by the disposal operation at ESC CMP Vd.
Concentrations of Ammonia Nitrogen (NH3-N) were similar
amongst all stations in October 2017 (Table B4 of Annex
B; Figure 8 of Annex
C). Levels of 5-day Biochemical Oxygen
Demand (BOD5) were relatively similar amongst all stations in October 2017 (Table B4 of Annex
B; Figure 9 of Annex
C).
1.5.14
Analyses of results for October 2017 indicated
that the SS levels at Reference and
Intermediate stations were higher than the WQO (11.0 mg/L for wet season), however
SS levels compiled with the Action and Limit Levels at all stations (Tables B1 and B4 of Annex
B; Figure 10 of Annex
C).
1.5.15
Overall, results of the Routine
Water Quality Monitoring indicated that the disposal
operation at ESC CMP Vd did not appear to cause any
unacceptable deterioration in water quality in October 2017. Detailed statistical analysis will be
presented in the Quarterly Report to investigate any spatial and temporal
trends of potential concern.
1.5.16
Pit
Specific Sediment Chemistry of ESC CMP Vd
�V September and October 2017
1.5.17
Monitoring locations for Pit
Specific Sediment Chemistry for ESC CMP Vd are shown in Figure 1.3. A total of six (6) monitoring stations
were sampled in September and October 2017.
1.5.18
The concentrations of most inorganic contaminants were
lower than the Lower Chemical Exceedance Level (LCEL) at all stations in September and October 2017, except Arsenic, Copper and
Silver in September 2017 and Arsenic in October 2017 (Figures 11, 12, 15 and 16
of Annex C). In September
2017, concentrations of Arsenic exceeded the LCEL at Active Pit station
ESC-NPAB while concentrations of Copper and Silver exceeded the LCEL at Active
Pit station ESC-NPAA (Figures 11 and 12
of Annex C). In October
2017, concentrations of Arsenic exceeded the LCEL at Active Pit station
ESC-NPAB (Figure 15 of Annex C).
1.5.19
Whilst the average concentration
of Arsenic in the Earth��s crust is generally ~2mg/kg, significantly higher
Arsenic concentrations (median = 14 mg/kg) have been recorded in Hong Kong��s
onshore sediments ([5]).
It is presumed that the natural concentrations of Arsenic are similar in
onshore and offshore sediments ([6]), and relatively high Arsenic levels may
thus occur throughout Hong Kong.
Therefore, the LECL exceedances of Arsenic are unlikely to be caused by
the disposal operations at ESC CMP Vd but rather as a
result of naturally occurring deposits.
1.5.20
Since the Active Pit stations are
located within ESC CMP Vd which were
receiving contaminated mud during the reporting period, the exceedances of LCEL
for Copper and Silver recorded at the Action Pit stations only are not
considered as indicating any dispersal of contaminated mud from ESC CMP Vd.
1.5.21
For organic contaminants, the
concentrations of Total Organic Carbon (TOC) were similar in September and
October 2017 (Figures 13 and 17 of Annex C). The concentrations of Tributyltin (TBT) were higher at Active Pit station ESC-NPAA
in September and October 2017 (Figures 14 and 18 of Annex C). Low and High
Molecular Weight Polycyclic Aromatic Hydrocarbons (PAHs), Total Polychlorinated
Biphenyls (PCBs), Total dichloro-diphenyl-trichloroethane (DDT) and
4,4��-dichlorodiphenyldichloroethylene (DDE) concentrations were below the limit
of reporting at all stations in September and October 2017.
1.5.22
Overall, there is no evidence
indicating any unacceptable environmental impacts to sediment quality as a
result of the contaminated mud disposal operations at ESC CMP Vd in September and October 2017. Statistical
analysis will be undertaken and presented in the corresponding quarterly report
to investigate whether there are any unacceptable impacts in the area caused by
the contaminated mud disposal.
1.5.23
Sediment
Chemistry after a Major Storm of ESC CMP V �V August and
October 2017
1.5.24
Sampling for Sediment Chemistry
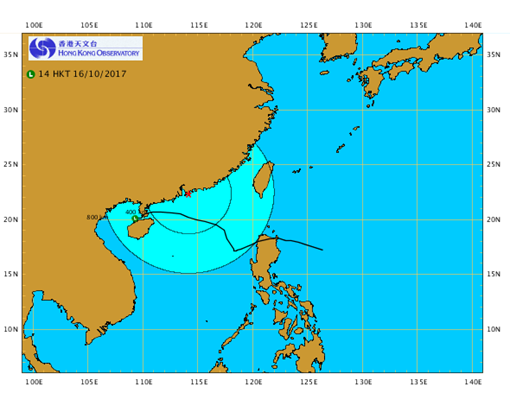
after a Major Storm Event was conducted at nine (9) monitoring stations (Figure 1.4) on 31 August 2017 and 19 October 2017 after the visit of
tropical cyclones Hato and Khanun, which led to the issue of No. 10 Hurricane Signal on 23 August 2017
and No. 8 Northeast Gale or Storm Signal on 15 October 2017, respectively. The tracks of Hato and Khanun are shown in Figures
1.5 and 1.6.
Figure 1.5 Track
of Tropical Cyclone Hato from 20 to 24 August 2017 (Source: Hong Kong Observatory)
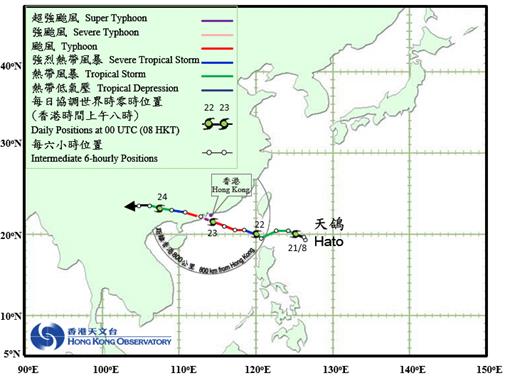
Figure 1.6 Track
of Tropical Cyclone Khanun from 12 to 16 October 2017
(Source: Hong Kong Observatory)
1.5.25
Analyses of results for the Sediment
Chemistry after a Major Storm indicated that the concentrations
of most inorganic contaminants were below the LCEL, except Arsenic at
Near-field station ESC-RNB, Mid-field stations ESC-RMA and ESC-RMB, Far-field
stations ESC-RFA and ESC-RFB and Copper at Ma Wan station in August 2017 (Figures 19 and 20
of Annex C). In October 2017, the
concentrations of most inorganic contaminants were below the LCEL, except Arsenic at Mid-field
stations ESC-RMA and ESC-RMB and Far-field station ESC-RFB (Figures 21 and 22
of Annex C).
1.5.26
As
discussed in Section 1.5.19, the natural levels of Arsenic are relatively
high in Hong Kong��s marine sediment ([7]), the slight exceedances of LCEL for Arsenic are
unlikely to be caused by the disposal of contaminated mud at ESC CMPs but
rather as a result of naturally occurring deposits.
1.5.27
Ma Wan
station is located further away from the works area
of ESC CMPs when compared the Near-field, Mid-field and Far-field stations at
which the level of Copper did not exceed the LCEL, therefore the exceedance of LCEL for Copper recorded at Ma Wan
station only is not considered as indicating any dispersal of contaminated mud
from ESC CMP Vd.
1.5.28
Overall, there appeared to be no
evidence showing the failure of ESC CMP V in retaining disposed mud or causing contamination of sediments after
the major storm event in August and October 2017.
1.6
Brief Discussion of the Monitoring Results for SB CMPs
1.6.1
Brief discussion of the monitoring results of the following
activities for SB CMPs is presented in this Monthly
EM&A Report for October 2017:
�P
Water Quality Monitoring during Capping Operations of SB CMPs
in September 2017.
1.6.2
Water Quality Monitoring during Capping of SB CMPs �V September 2017
1.6.3
Capping works at SB CMP 2 were
conducted in September 2017 to supplement and revert
the portion of consolidated capping layer to design level and was completed in
September 2017. Post-water quality
monitoring was then conducted on 29 September 2017 after the completion of
capping works at SB CMP 2. The monitoring results obtained have been assessed for
compliance with the WQOs (see Section 1.5.3 for details). A total of fourteen (14)
monitoring stations were sampled in September 2017 as shown in Figure 1.7. Results of in-situ measurements were presented in
the Monthly EM&A Report for September 2017. The results of laboratory measurements
are presented in the section below.
Graphical presentation of the
laboratory monitoring results is shown in Figures 23 - 26 of Annex C.
Laboratory Measurements
1.6.4
The concentrations of SS were higher
than the WQO (11.0 mg/L for wet season) at Sham Shui
Kok station in September 2017 (Table B6 of Annex B; Figure
23 of Annex C). However, levels of SS at all stations complied with the
Action and Limit Levels (Tables B5 and B6 of Annex B).
1.6.5
For nutrients, concentrations of NH3-N were lower at Reference, Tai Ho Bay 1 and Tai Ho Bay 2 stations (Table B6 of Annex B; Figure
24 of Annex C). The levels of TIN at most stations were higher than WQO of 0.5 mg/L, except for
Ma Wan station (Table
B6 of Annex B; Figure 25 of Annex
C). As discussed in Section 1.5.13, the North Western WCZ has historically experienced higher
levels of TIN ([8]). The exceedances of TIN WQO at these
stations are unlikely to be caused by the capping operation at CMP 2. Levels of BOD5 were higher at
Tai Ho Bay 2 station in
September 2017 (Table B6 of Annex
B; Figure 26 of Annex C).
1.6.6
Overall, the monitoring results indicated that the capping operation at CMP 2 did not appear
to cause any unacceptable deterioration in water quality in September 2017. Statistical analysis will be
undertaken and presented in the quarterly report to investigate whether the
capping operations at CMP 2 is causing any unacceptable impacts in water quality of the area.
1.7
Activities Scheduled for the Next Month
1.7.1
The following monitoring activities will be conducted in the next monthly period of November
2017 for ESC CMP V (see Annex A for the sampling schedule):
�P Routine
Water Quality Monitoring of ESC CMP Vd;
�P Water
Column Profiling of ESC CMP Vd; and
�P Pit
Specific Sediment Chemistry of ESC CMP Vd.