Agreement No. CE
63/2016 (EP)
Environmental Monitoring and Audit
for Disposal Facility to the East of Sha Chau (2017-2020) - Investigation
MONTHLY EM&A REPORT FOR September 2017
1.1.1
The Civil
Engineering and Development Department (CEDD) is managing a number of marine
disposal facilities in Hong Kong waters, including the Contaminated Mud Pits
(CMPs) to the South of The Brothers (SB) and to the East of Sha Chau (ESC) for
the disposal of contaminated sediment, and open-sea disposal grounds located to
the South of Cheung Chau (SCC), East of Tung Lung Chau (ETLC) and East of
Ninepins (ENP) for the disposal of uncontaminated sediment. Two Environmental Permits (EPs),
EP-312/2008/A and EP-427/2011/A, were issued by the Environmental Protection
Department (EPD) to the CEDD, the Permit Holder, on 28 November 2008 and 23
December 2011 for the Dredging, Management and Capping of Contaminated Sediment
Disposal Facilities at ESC CMP V and SB CMPs, respectively.
1.1.2
Under the
requirements of the two EPs
for ESC CMP V and SB CMPs, EM&A programmes which encompass water
and sediment chemistry, fisheries assessment, tissue and whole body analysis,
sediment toxicity and benthic recolonisation studies
as set out in the EM&A Manuals are required to be implemented. EM&A programmes
have been continuously carried out during the operation of the CMPs at ESC and
SB. A review of the
collection and analysis of such environmental data from the monitoring
programme demonstrated that there had not been any adverse environmental
impacts resulting from disposal activities () (). The current programme will assess the impacts resulting
from dredging, disposal and capping operations of CMP V as well as capping
operations of SB CMPs.
1.1.3
The
present EM&A programme under Agreement No. CE 63/2016 (EP) covers the
dredging, disposal and capping operations of the ESC CMP V as well as the capping
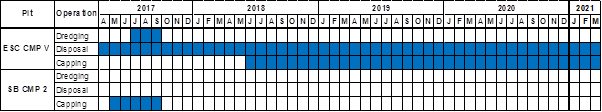
operations of the SB CMPs (see Annex A for the EM&A programme). Detailed works schedule for ESC CMP V and
SB CMPs is shown in Figure
1.1. In September 2017, the following works
were being undertaken:
�P Dredging operation at ESC CMP Vb;
�P Disposal of contaminated mud at
ESC CMP Vd; and
�P Capping operation at SB CMP 2.
Figure 1.1 Works Schedule for ESC CMP V and SB CMPs
1.2
Reporting Period
1.2.1
This Monthly EM&A Report for September 2017 covers
the EM&A activities for the reporting month of September 2017.
1.3
Details of Sampling and
Laboratory Testing Activities
1.3.1
The following monitoring activities were undertaken for ESC
CMP V in September 2017:
�P
Water Quality Monitoring during
Dredging of ESC CMP Vb was undertaken on 1, 6, 8, 11, 13, 15, 18, 20, 22 and 25 September 2017;
�P
Water Column Profiling of ESC CMP Vd was
undertaken on 7 September 2017; and
�P
Pit Specific Sediment Chemistry of ESC CMP Vd was
undertaken on 12 September 2017.
1.3.2
The following monitoring activities were undertaken for SB
CMPs in September 2017:
�P
Water Quality Monitoring During Capping of SB CMPs was undertaken on 29 September 2017.
1.4
Details of Outstanding
Sampling and/or Analysis
1.4.1
No outstanding sampling remained for
September 2017.
1.4.2
The following
laboratory analyses are in progress during the preparation of this monthly
report and will be presented in the next monthly report once the data are
available:
�P Laboratory analyses of
sediment samples collected for Pit Specific
Sediment Chemistry of ESC CMP Vd in September 2017;
and
�P Laboratory analyses of
water samples collected for Water Quality Monitoring During Capping of SB CMPs in September 2017.
1.5.1
Brief discussion of the monitoring
results of the following activities for ESC CMP V is presented in this Monthly
EM&A Report for September 2017:
�P
Water Quality Monitoring During
Dredging of ESC CMP Vb in September 2017; and
�P
Water Column Profiling of ESC CMP Vd in September 2017.
1.5.2
Impact
Water Quality Monitoring during Dredging Operations of ESC CMP Vb �V September 2017
1.5.3
Dredging activities were carried out on 1 �V 2, 4 �V 16, 18 �V 25
September 2017 during this reporting period and
monitoring was conducted on 1, 6, 8,
11, 13, 15, 18, 20, 22 and 25 September 2017. During each survey day,
monitoring was conducted during both mid-ebb and mid-flood tides at two
Reference (Upstream) stations and five Impact (Downstream) stations around the dredging operations at ESC CMP
Vb. Monitoring was also conducted
at one Sensitive Receiver station situated in Ma Wan.
A total of eight (8) stations were monitored and locations of the
sampling stations are shown in Figure
1.2. Levels of Dissolved Oxygen (DO),
Turbidity and Suspended Solid (SS) were assessed for compliance with the Action
and Limit Levels (see Table B1 of Annex B for details) set in the
Baseline Monitoring Report ().
1.5.4
Monitoring results are presented in Table B2 of Annex
B. Daily dredging volume in September 2017 is
reported in Annex
C. Levels of DO, Turbidity and SS generally complied with
the Action and Limit Levels (see Table B1 of Annex B for details) set in the Baseline Monitoring Report (),
except for the following occasions discussed in Table 1.1 below.
1.5.5
The results indicated that the dredging operations at ESC
CMP Vb did not appear to cause any unacceptable
deterioration in water quality during this reporting period. Therefore, no further action, except for
those recommended in the Environmental Permit (EP-312/2008/A), are considered necessary for the dredging operations.
1.5.6
Water
Column Profiling of ESC CMP Vd
�V September 2017
1.5.7
Water
Column Profiling was undertaken at a total of two
sampling stations (Upstream and Downstream stations) on 7 September 2017. The monitoring results have been assessed for
compliance with the Water Quality Objectives (WQOs) set by Environmental
Protection Department (EPD). This consists
of a review of the EPD routine water quality monitoring data for the wet season
period (April to October) of 2006 - 2015 from stations in the Northwestern
Water Control Zone (WCZ), where the ESC CMPs are located (). For Salinity, the averaged value
obtained from the Reference (Upstream) station was used for the basis as the WQO. Levels of DO and Turbidity were also assessed for compliance with the
Action and Limit Levels (see Table B1 of Annex B for details).
In-situ
Measurements
1.5.8
Analyses of results for September 2017 indicated that levels
of DO, Salinity and pH complied with the WQOs at both Downstream and Upstream stations (Table
B3
of Annex
B). In addition, levels of DO and Turbidity at all stations complied with the Action and Limit
Levels (Tables B1 and B3 of Annex B).
Laboratory Measurements for Suspended Solids (SS)
1.5.9
Analyses of results for September 2017 indicated that the SS
levels complied with the WQO and the Action and Limit Levels at both Upstream
and Downstream stations (Tables B1 and B3 of
Annex B).
1.5.10
Overall, the monitoring results indicated that the mud
disposal operation at ESC CMP Vd did not appear to
cause any deterioration in water quality during this reporting period.
1.6.1
Brief discussion of the monitoring
results of the following activities for SB CMPs is presented in this Monthly
EM&A Report for September 2017:
�P
Water Quality Monitoring during Capping Operations of SB CMPs
in September 2017.
1.6.2
Water
Quality Monitoring during Capping of SB CMPs �V September
2017
1.6.3
Capping works at SB CMP 2 were
conducted in September 2017 to supplement and revert
the portion of consolidated capping layer to design level and was completed in
September 2017. Post-water quality
monitoring was then conducted on 29 September 2017 after the completion of
capping works at SB CMP 2. The monitoring results obtained have been assessed for
compliance with the WQOs (see Section 1.5.7 for details). Levels of DO and Turbidity were also assessed for compliance with the
Action and Limit Levels (see Table B4 of Annex
B for details). A total of fourteen (14) monitoring stations were sampled in September 2017 as shown in Figure 1.3. Graphical
presentation of the monitoring results is shown in Figures 1 - 6 of Annex D.
In-situ Measurements
1.6.4
The levels of pH at all stations in September 2017 complied with the WQO (Table
B5 of Annex B; Figure 1 of Annex D). The
levels of Turbidity at all stations complied
with the Action and Limit levels in September 2017 (Table B5 of Annex B; Figure 2 of Annex
D). The levels of DO at all stations complied with the WQO and the Action and Limit
levels in September 2017 (Table B5 of Annex B; Figure 4 of Annex
D). The levels
of Salinity at Intermediate, Ma Wan, Sham Shui Kok and Tai Mo To stations
are higher than the WQOmax in September 2017 (Table B5 of Annex
B; Figure 6 of Annex D). The Salinities at these stations were higher than the WQOmax
as they were located further away from the Tai Ho Bay and Reference stations,
thus experiencing less freshwater runoff from the nearby streams. The levels of Salinity at Tai Ho Bay 2
station are lower than the WQOmin in September 2017 (Table B5 of Annex
B; Figure 6 of Annex D). The lower
Salinity levels at Tai Ho Bay 2 station are likely to be caused by the freshwater runoff from the nearby streams.
1.7
Activities Scheduled for the
Next Month
1.7.1
The following monitoring activities will be conducted in the next monthly
period of October 2017 for ESC CMP V (see Annex
A for the sampling schedule):
�P
Routine Water Quality Monitoring of ESC CMP Vd;
�P
Water Column Profiling of ESC CMP Vd; and
�P
Pit Specific Sediment Chemistry of ESC CMP Vd.
1.7.2
No monitoring activities are scheduled in the next monthly
period of October 2017 for SB CMPs.
1.8.1
A summary of the Study programme is presented in Annex E.