|
|
|
|
|
|
|
Agreement No. CE 63/2016 (EP) Environmental Monitoring and Audit MONTHLY EM&A REPORT FOR June 2017 |
1.1
Background
1.1.1
The Civil
Engineering and Development Department (CEDD) is managing a number of marine
disposal facilities in Hong Kong waters, including the Contaminated Mud Pits
(CMPs) to the South of The Brothers (SB) and to the East of Sha Chau (ESC) for
the disposal of contaminated sediment, and open-sea disposal grounds located to
the South of Cheung Chau (SCC), East of Tung Lung Chau (ETLC) and East of
Ninepins (ENP) for the disposal of uncontaminated sediment. Two Environmental Permits (EPs),
EP-312/2008/A and EP-427/2011/A, were issued by the Environmental Protection
Department (EPD) to the CEDD, the Permit Holder, on 28 November 2008 and 23
December 2011 for the Dredging, Management and Capping of Contaminated Sediment
Disposal Facilities at ESC CMP V and SB CMPs, respectively.
1.1.2
Under the
requirements of the two EPs
for ESC CMP V and SB CMPs, EM&A programmes which encompass water
and sediment chemistry, fisheries assessment, tissue and whole body analysis,
sediment toxicity and benthic recolonisation studies
as set out in the EM&A Manuals are required to be implemented. EM&A programmes
have been continuously carried out during the operation of the CMPs at ESC and
SB. A review of the
collection and analysis of such environmental data from the monitoring
programme demonstrated that there had not been any adverse environmental
impacts resulting from disposal activities ([1])([2])([3])([4])([5]). The current programme will assess the impacts resulting from
dredging, disposal and capping operations of CMP V as well as capping
operations of SB CMPs.
1.1.3
The present
EM&A programme under Agreement
No. CE 63/2016 (EP) covers the dredging, disposal and capping operations of the
ESC CMP V as well as the
capping operations of the SB CMPs (see Annex
A for
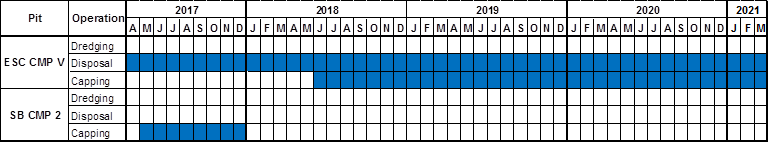
the EM&A programme). Detailed works schedule for ESC CMP V and
SB CMPs is shown in Figure 1.1. In June 2017, the following works were
being undertaken:
�P Disposal of contaminated mud at
ESC CMP Vd; and
�P Capping operation at SB CMP 2.
Figure 1.1 Works Schedule for ESC CMP V and SB
CMPs
1.2
Reporting Period
1.2.1
This Monthly EM&A Report for June 2017 covers
the EM&A activities for the reporting month of June 2017.
1.3
Details of Sampling and
Laboratory Testing Activities
1.3.1
The following monitoring activities were undertaken for ESC
CMP V in June 2017:
�P
Pit Specific Sediment Chemistry of ESC CMP Vd was
undertaken on 13 June 2017;
�P
Cumulative Impact Sediment Chemistry of ESC CMPs was undertaken on 13 and 14 June 2017;
�P
Water Column Profiling of ESC CMP Vd was undertaken
on 17 June 2017; and
�P
Sediment Chemistry after a Major
Storm of ESC CMPs was
undertaken on 19 June 2017.
1.3.2
The following monitoring activity was undertaken for SB CMP 2 in June 2017:
�P
Water Quality Monitoring During
Capping of SB CMPs was
undertaken on 16 June 2017.
1.4
Details of Outstanding
Sampling and/or Analysis
1.4.1
No outstanding sampling remained for June 2017.
1.4.2
The following laboratory analyses are in progress during the
preparation of this monthly report and will be presented in the next monthly report
once the data are available:
�P Laboratory analyses of
sediment samples collected for Pit
Specific
Sediment Chemistry of ESC CMP Vd
in June 2017;
�P Laboratory analyses of
sediment samples collected for Cumulative Impact Sediment
Chemistry of ESC CMPs in June 2017; and
�P Laboratory analyses of
sediment samples collected for Sediment
Chemistry after a Major Storm of ESC CMPs
in June 2017.
1.5
Brief Discussion of the Monitoring Results for ESC
CMPs
1.5.1
Brief discussion of the monitoring
results of the following activities for ESC CMPs is presented in this Monthly
EM&A Report for June 2017:
�P
Water Column Profiling of ESC CMP Vd in June 2017; and
�P
Pit Specific Sediment
Chemistry of ESC CMP Vd in May 2017.
1.5.2
Water
Column Profiling of ESC CMP Vd
�V June 2017
1.5.3
Water
Column Profiling was undertaken at a total of two
sampling stations (Upstream and Downstream stations) on 17 June 2017. The monitoring results have been assessed for
compliance with the Water Quality Objectives (WQOs) set by Environmental Protection
Department (EPD). This consists of a review of the EPD routine water quality monitoring
data for the wet season period (April to October) of 2006 - 2015 from stations in the Northwestern
Water Control Zone (WCZ), where the ESC CMPs are located ([6]). For Salinity, the averaged value
obtained from the Reference (Upstream) station was used for the basis as the WQO. Levels of Dissolved Oxygen (DO) and Turbidity were also assessed for
compliance with the Action and Limit Levels (see Table B1 of Annex B for details).
In-situ
Measurements
1.5.4
Analyses of results for June 2017 indicated that levels of DO and pH complied
with the WQOs at both Downstream and Upstream stations
(Table B2 of Annex B). In addition, DO and
Turbidity at all stations complied with the Action and Limit Levels (Tables
B1 and B2 of Annex B).
Laboratory
Measurements for Suspended Solids (SS)
1.5.5
Analyses of results for June 2017 indicated that the SS
levels complied with the WQO and the Action and Limit Levels at both Upstream
and Downstream stations (Tables B1 and B2 of
Annex B).
1.5.6
Overall, the monitoring results indicated that the mud
disposal operation at ESC CMP Vd did not appear to
cause any deterioration in water quality during this reporting period.
1.5.7
Pit
Specific Sediment Chemistry of ESC CMP Vd
�V May 2017
1.5.8
Monitoring locations for Pit
Specific Sediment Chemistry for ESC CMP Vd are shown in Figure 1.2. A total of six
(6) monitoring stations were sampled in May 2017.
1.5.9
The concentrations of all inorganic contaminants were
lower than the Lower Chemical Exceedance Level (LCEL) at all stations in May 2017 (Figures 1 and 2 of Annex C).
1.5.10
For organic contaminants, the concentrations of Total Organic
Carbon (TOC) were similar amongst the stations in May 2017 (Figure 3 of Annex C). The concentrations of Tributyltin (TBT) were higher at Active Pit stations ESC-NPAA
and ESC-NPAB in May 2017 (Figure 4 of Annex C). Low and High Molecular
Weight Polycyclic Aromatic Hydrocarbons (PAHs), Total Polychlorinated Biphenyls
(PCBs), Total dichloro-diphenyl-trichloroethane
(DDT) and 4,4��-dichlorodiphenyldichloroethylene (DDE) concentrations were below
the limit of reporting at all stations in May 2017.
1.5.11
Overall, there is no evidence indicating any unacceptable
environmental impacts to sediment quality as a result of the contaminated mud
disposal operations at ESC CMP Vd in May
2017.
Statistical analysis will be undertaken and presented in the
corresponding quarterly report to investigate whether there are any
unacceptable impacts in the area caused by the contaminated mud disposal.
1.6
Brief Discussion of the Monitoring Results for SB CMPs
1.6.1
Brief discussion of the monitoring
results of the following activities for SB CMPs is presented in this Monthly
EM&A Report for June 2017:
�P
Water Quality Monitoring during Capping Operations of SB CMPs
in June 2017.
1.6.2
Water
Quality Monitoring during Capping of SB CMPs �V June
2017
1.6.3
Capping works at SB CMP 2 were
conducted in June 2017 to supplement and revert the
portion of consolidated capping layer to design level and is expected to be completed
by December 2017. The monitoring results obtained during
June 2017 sampling in the wet season have been assessed for compliance with the WQOs (see Section 1.5.3 for
details). Levels of DO and Turbidity were also assessed for compliance with the
Action and Limit Levels (see Table B3 of Annex B for details). A total of fourteen (14) monitoring stations were sampled in June 2017 as shown in Figure 1.3. Graphical
presentation of the monitoring results is shown in Figures 5 - 14 of Annex C.
In-situ Measurements
1.6.4
The levels of pH at all stations in June 2017 complied with the WQO (Table
B4 of Annex B; Figure 5 of Annex C). The
levels of Turbidity at all stations complied
with the Action and Limit levels in June 2017 (Table B4 of Annex B; Figure 6 of Annex C). The levels of DO at all stations complied with the WQO and the Action and Limit
levels in June 2017 (Table B4 of Annex B; Figure 8 of Annex C). The levels of Salinity at
Impact, Intermediate, Ma Wan, Sham Shui Kok and Tai Mo To stations are higher than the WQOmax in June 2017 (Table B4 of Annex B; Figure 10 of Annex C). The Salinities at these
stations were higher than the WQOmax as they were located further away from the
Tai Ho Bay and Reference stations, thus experiencing less freshwater runoff
from the nearby streams.
Laboratory Measurements
1.6.5
The concentrations of SS were higher
than the WQO (11.0
mg/L for wet season) at Impact, Sham Shui Kok, Tai Mo To and Tai Ho
Bay 1 station in June 2017 (Table B4 of Annex B; Figure 11 of Annex C). However, levels of SS at all stations complied with the Action and Limit Levels (Table B3 and B4 of Annex
B).
1.6.6
For nutrients, concentrations of Ammonia Nitrogen (NH3-N) were relatively
similar amongst all stations, except the concentrations of NH3-N recorded at Tai Ho Bay 2
station was lower than the other stations (Table B4 of Annex B; Figure 12 of Annex
C). The levels of Total Inorganic Nitrogen (TIN) at all stations were higher the WQO of
0.5 mg/L (Table B4 of Annex B; Figure 13 of Annex
C). It is important to note that due to the
effect of the Pearl River, the North
Western WCZ has historically experienced higher levels of TIN ([7]). The exceedances of TIN WQO at these
stations are unlikely to be caused by the capping operation at CMP 2. Levels of
5-day Biochemical Oxygen Demand (BOD5) were higher at Reference and Tai Ho Bay 2 stations in June 2017 (Table B4 of Annex B; Figure 14 of Annex
C).
1.6.7
Overall, the monitoring results indicated that the capping operation at CMP 2 did not appear
to cause any unacceptable deterioration in water quality in June 2017. Statistical analysis will be undertaken and presented in the quarterly
report to investigate whether the capping operations at CMP 2 is causing any
unacceptable impacts in water quality of the area.
1.7
Activities Scheduled for the
Next Month
1.7.1
The following monitoring
activities will be conducted in the next monthly period of July
2017 for ESC CMP V (see Annex A for the sampling schedule):
�P
Water Column Profiling of ESC CMP Vd;
�P
Routine Water Quality
Monitoring of ESC CMP Vd;
�P
Pit Specific Sediment Chemistry of ESC CMP Vd; and
�P
Demersal Trawling of ESC
CMPs.