Agreement No. CE 4/2009 (EP)
Environmental Monitoring and Audit
for Contaminated Mud Pit at Sha Chau
(2009-2013) - Investigation
4th
MONTHLY PROGRESS REPORT FOR CONTAMINATED MUD PITS AT SHA CHAU - October 2009
1.1
Background
Since 1992, the East of Sha Chau area has been the site
of a series of dredged contaminated mud pits (CMPs) designed
to provide confined marine disposal capacity for contaminated mud arising from
the HKSAR’s dredging and reclamation projects. CMP IVc is
presently in operation for backfilling by contaminated mud and is anticipated
to reach its capacity in 2010. A series of four newly constructed seabed pits at the East of Sha Chau area, CMP Va-d, will be provided for the disposal of contaminated mud
after CMP IVc is full. Dredging operations are now taking place to
construct CMP Va. The environmental
monitoring and audit (EM&A) programme for the CMPs
at the East of Sha Chau
area presently covers disposal operations at CMP IVc
and dredging operations at CMP V.
1.2
Reporting Period
This Monthly Progress Report
covers the monitoring period from July to October 2009.
1.3
Details of Sampling and
Laboratory Testing Activities
Sampling for Impact Monitoring during Dredging Operations
of CMP V was conducted on 8 October 2009.
Data for laboratory analysis of samples collected in July 2009 for Sediment Chemistry after a Major Storm Event
and Water Column Profiling for CMP IV
were received from the Contractor on 15 October 2009. A summary of field activities are presented
in Annex A.
1.4
Details of Outstanding
Sampling and / or Analysis
Water
Column Profiling for CMP V was not conducted in this sampling month as there
were no dredging activities on the scheduled sampling day due to maintenance of
the dredger. Data from the Contractor
that remain outstanding include concentrations of Total Polycyclic Aromatic
Hydrocarbons (PAHs) and Tributyltin
(TBT) in sediment samples and TBT in interstitial water samples for Pit Specific Sediment Chemistry and Cumulative Impact Sediment Chemistry. In addition, data for Particle Size
Distribution of the sediment samples for July 2009 sampling for Sediment Chemistry after a Major Storm Event
remain outstanding from the Contractor.
1.5
Brief Discussion of the
Monitoring Results
For CMP IV, monitoring results for Water
Column Profiling, Sediment Chemistry after a Major Storm Event and Demersal Trawling
for July and August 2009 as well as Routine
Water Quality Monitoring, Benthic Macro-Infauna &
Taxonomic Identification, Pit Specific Sediment Chemistry and Cumulative Impact Sediment Chemistry for
August 2009 are presented below. Further
for CMP V, monitoring results are presented for Impact Monitoring during Dredging Operations for October 2009. Detailed results will be discussed in the
relevant Quarterly Reports.
1.5.1
Water Column Profiling for CMP IV during July 2009
Results of Water
Column Profiling for July 2009 show that salinity, pH and Dissolved Oxygen
(DO) all compiled with the Water Quality Objectives (WQOs)
at both Upstream and Downstream stations (Figures
2 to 4 of Annex B). However, levels of Total Suspended Solids
(TSS) exceeded the WQO at both Upstream and Downstream
stations (Figure 1 of Annex B).
1.5.2
Water Column Profiling for CMP IV during August 2009
Results of Water
Column Profiling for August 2009 show that salinity and pH complied with
the WQOs at both Upstream and Downstream stations (Figures 6 and 7 of Annex B). However, levels of DO and TSS at both the
Upstream and Downstream stations did not comply with the WQOs
(Figure 5 and 8 of Annex B).
1.5.3
Routine Water Quality Monitoring for CMP IV during August 2009
In-situ Measurements
Levels of pH, DO and Salinity
complied with the WQOs at all stations during Routine Water Quality Monitoring in
August 2009 (Figures 9, 12 and 13 of Annex B). All in-situ
water quality measurements showed relatively minor variations between
Impact, Intermediate and Reference stations (Figures 9 to 14 of Annex B).
Laboratory Measurements
Concentrations of Arsenic, Cadmium, Chromium, Mercury
and Silver were all below the limits of detection. Whereas, Copper, Lead, Nickel and Zinc were detected
in water samples and their concentrations were relatively similar among the
Impact, Intermediate and Reference stations (Figure 15 of Annex B). Similarly, concentrations of Total Inorganic
Nitrogen and Ammoniacal-Nitrogen showed only minor
differences between the Impact, Intermediate and Reference stations (Figure 16 of Annex B). Levels of TSS complied with the WQO (10.0mg L-1)
at the Intermediate station, however, exceedances of
the WQO were observed at both the Impact and Reference stations (Figure 17 of Annex B). Levels of BOD5 were below
detection limits at all stations.
1.5.4
Sediment Chemistry after a Major Storm Event for CMP
IV (Molave)
Sampling for Sediment Chemistry after a Major Storm Event
was conducted on 22 July 2009 after the visit of Tropical Cyclone Molave, which led
to the issue of No. 8 Gale or Storm
Signal on 18 July 2009 and No. 9 Gale or Storm Signal on 19 July
2009. The track of Molave is shown in Figure
1.4.1.
|
|
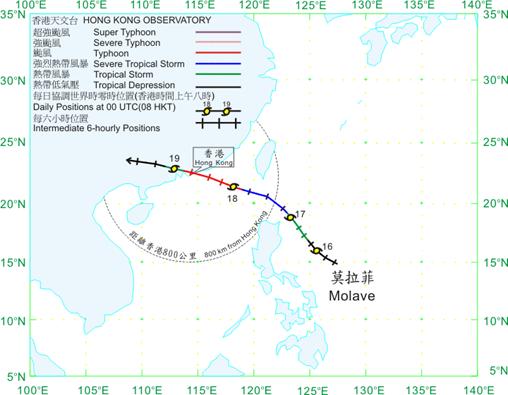
Figure 1.4.1 Track of Tropical Cyclone Molave
from 15-19 July 2009 (Source:
Concentrations of all metals,
except Arsenic, were below the Lower
Chemical Exceedance Limit (LCEL) and Upper Chemical Exceedance Limit (UCEL)
(Figures 18 and 19 of Annex B). Concentrations of Arsenic in sediments from
all stations exceeded LCEL (12
mg/kg), but remained below UCEL (42
mg/kg).
Moisture content in the
sediments from all stations ranged between 42.2 - 60.6% (Figure 20 of Annex B). Data for Particle Size Distribution of sediment
samples remains outstanding from the Contractor.
1.5.5
Sediment Chemistry after a Major Storm Event for CMP
IV (Goni)
Sampling for Sediment Chemistry after a Major Storm Event
was conducted on 7 August 2009 after the visit of Tropical Cyclone Goni, which led
to the issue of No. 8 Gale or Storm
Signal on 5 August 2009. The track of Goni is shown in Figure
1.4.2.
|
|
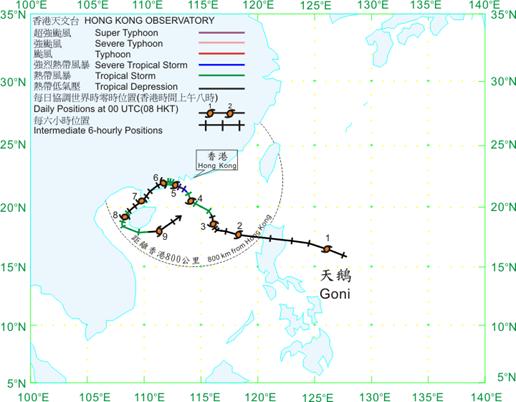
Figure 1.4.2 Track of Tropical Cyclone Goni from 1-9 August 2009 (Source:
Concentrations of all metals,
except Arsenic, were below the LCEL
and UCEL (Figures 21 and 22 of Annex B).
Concentrations of Arsenic in sediments from all stations exceeded LCEL (12 mg/kg), but remained below UCEL (42 mg/kg).
Moisture content in the
sediments from all stations ranged between 45.4 - 57.5% (Figure 23 of Annex B). Sediments were mainly composed of sand (35.9
– 65.1 %) and gravel (25.4 – 30.8 %) materials (Figure 24 of Annex B).
1.5.6
Benthic Macro-Infauna and
Taxonomic Identification
A benthic survey was
conducted at the Capped Mud Pit stations and at the Reference stations to the
south of Sha Chau in August
2009. A total of 73 individuals,
belonging to eight animal phyla were obtained from the monitoring
stations. Table 1.4.1 summarises the results of the benthic survey.
Table 1.4.1 Summary of Benthic
Survey Results during August 2009 Monitoring
|
Area |
Station |
No. of individuals (Total) |
Biomass (g) (Total) |
No. of Individuals (Per Station) |
Biomass (g) (Per Station) |
Average Biomass per individual (mg) |
Average Number of Genera |
||||
|
Capped Stations |
|||||||||||
|
CPA |
3 |
7 |
0.23 |
2.33 |
0.08 |
0.03 |
5 |
||||
|
CPB |
3 |
16 |
9.07 |
5.33 |
3.02 |
0.57 |
8 |
||||
|
CPC |
3 |
8 |
3.29 |
2.67 |
1.10 |
0.41 |
6 |
||||
|
(Total) |
|
31 |
12.59 |
10.33 |
4.20 |
1.01 |
19 |
||||
|
Reference Stations |
|||||||||||
|
RBA |
3 |
14 |
21.11 |
4.67 |
7.04 |
1.51 |
8 |
||||
|
RBB |
3 |
7 |
0.32 |
2.33 |
0.11 |
0.05 |
6 |
||||
|
RBC |
3 |
21 |
12.43 |
7.00 |
4.14 |
0.59 |
12 |
||||
|
(Total) |
|
42 |
33.86 |
14.00 |
11.29 |
2.15 |
26 |
||||
|
Total |
18 |
73 |
46.45 |
|
|
|
|
||||
Total number of individuals,
total biomass, average biomass per individual and average number of genera were
lower at the Capped stations than at the Reference stations.
1.5.7
Demersal Trawling for July
and August 2009
Abundance and Biomass
The average number of species
collected during the July and August 2009 sampling is presented in Table 1.4.2. In the July and August 2009 sampling, species
richness was relatively similar between the Impact and Reference stations.
Table 1.4.2 Summary
of the Mean Number of Faunal Species Caught during July and August 2009
Monitoring
|
Date of Sampling |
IMPACT STATIONS INA
INB |
REFERENCE STATIONS TNA
TNB TSA TSB |
||||
|
Jul 2009 |
37.2 |
41.0 |
38.0 |
35.8 |
42.4 |
38.8 |
|
Aug 2009 |
37.0 |
40.4 |
41.2 |
36.2 |
36.0 |
35.2 |
During July 2009, the number
of individuals per station, total biomass per station, mean Catch per Unit
Effort (CPUE) and mean Yield per Unit Effort (YPUE) of the catch were higher at
the Reference stations TSA and TSB compared to all other stations (Table 1.4.3). During August 2009, total biomass per station
and mean YPUE were higher at the Impact station INA and the Reference station
TSA, whereas the number of individuals per station and the mean CPUE were
highest at the Reference station TSA compared with all other stations (Table 1.4.3).
Table 1.4.3 Summary of CPUE and YPUE during July and August 2009 Monitoring
|
Date |
Stations |
Impact / Reference Stations |
No. of Individuals per Station |
Total Biomass per Station (g) |
Mean CPUE#1 per Tow |
Mean YPUE#2 per Tow
(g) |
|
Jul 2009 |
INA |
Impact |
12,196.0 |
82,073.3 |
2,439.2 |
16,414.7 |
|
Jul 2009 |
INB |
Impact |
11,055.0 |
71,573.6 |
2211 |
14,314.7 |
|
Jul 2009 |
TNA |
Reference |
10,036.0 |
63,738.1 |
2,007.2 |
12,747.6 |
|
Jul 2009 |
TNB |
Reference |
11,171.6 |
73,785.4 |
2,234.3 |
14,757.1 |
|
Jul 2009 |
TSA |
Reference |
18,343.0 |
104,439.1 |
3,668.6 |
20,887.8 |
|
Jul 2009 |
TSB |
Reference |
24,836.0 |
215,796.0 |
4,967.2 |
43,159.2 |
|
Aug
2009 |
INA |
Impact |
12,360.0 |
97,890.8 |
2,472.0 |
19,578.2 |
|
Aug
2009 |
INB |
Impact |
11,363.0 |
71,961.9 |
2,272.6 |
14,392.4 |
|
Aug
2009 |
TNA |
Reference |
8,896.0 |
67,743.5 |
1,779.2 |
13,548.7 |
|
Aug
2009 |
TNB |
Reference |
9,422.0 |
69,373.3 |
1,884.4 |
13,874.7 |
|
Aug
2009 |
TSA |
Reference |
24,240.0 |
102,574.9 |
4,848.0 |
20,515.0 |
|
Aug
2009 |
TSB |
Reference |
8,771.0 |
56,648.1 |
1,754.2 |
11,329.6 |
#1 CPUE is
calculated by dividing the number of individuals with the trawling time and
number of nets (in hour and number of nets)
#2 YPUE is calculated
by dividing the weight (g) of fish with trawling effort (in hour and number of
nets)
1.5.8
Pit Specific Sediment Chemistry for CMP IV during
August 2009
All metal concentrations at all stations were below the LCEL Sediment Criteria, with the exception of Arsenic (Figures
25 and 26 of Annex B). Concentrations of Arsenic exceeded LCEL at all stations. No metal concentrations exceeded UCEL (Figures 25 and 26 of Annex B). Overall, variation in the concentration of
metals among stations was minor (Figures
25 and 26 of Annex B).
Concentrations of Total DDT
and 4,4” DDE were lower than detection limits at all stations except at the
Near-Pit stations, where concentration remained relatively low (Figure 27 of Annex B) Total Organic Carbon concentrations in the
sediment were slightly higher at the Active-Pit stations relative to other
stations (Figure 28 of Annex B).
Sediments were mainly composed of sand (30.0 – 63.0 %) and gravel (22.0
– 32.5 %) materials (Figure 29 of Annex B).
Concentrations were below
detection limit at all stations for Low Molecular Weight (LMW) PAHs, High Molecular Weight (HMW) PAHs
and Polychlorinated biphenyls
(PCBs). Results for Total PAHs of the sediment samples remain outstanding from the
Contractor. Further, concentrations of Tributyltin (TBT) in interstitial water and in sediments are also outstanding from the
Contractor.
1.5.9
Cumulative Impact Sediment Chemistry for August 2009
Concentrations of all metals,
except Arsenic, were below LCEL (Figures 30 and 31 of Annex B). Concentrations of Arsenic in sediments from
all stations were above the LCEL. Overall, there were only minor differences in
metal concentrations between the stations (Figure
30 and 31 of Annex B). All metal
concentrations remained below UCEL (Figure 30 and 31 of Annex B).
The concentration of 4,4” DDE was higher at Mid-Field stations and Far-Field
station RFA compared to all other stations, which were below detection limits (Figure 32 of Annex B). Concentrations of Total DDT were below
detection limits at all stations except Mid-Field station RMB (Figure 32 of Annex B). Concentrations of Total Organic Carbon in
sediments were relatively similar between stations (Figure 33 of Annex B). Sediments were mainly composed of sand (31.8
– 56.4 %) and gravel (33.8 – 40.1 %) materials (Figure 34 of Annex B).
Concentrations were below
detection limit at all stations for Low Molecular Weight (LMW) PAHs, High Molecular Weight (HMW) PAHs
and Polychlorinated biphenyls
(PCBs). Results for Total PAHs of the sediment samples remain outstanding from the
Contractor. Further, concentrations of Tributyltin (TBT) in interstitial water and in sediments are also outstanding from the Contractor.
1.5.10
Impact Monitoring during Dredging Operations of CMP V
– October 2009
Impact
Monitoring during Dredging Operations of CMP V was conducted on 8 October
2009. Sampling was conducted during both
mid-ebb and mid-flood tides at two Reference (Upstream) stations upstream and
five Impact (Downstream) stations downstream of the dredging operations at CMP
V. Monitoring was also conducted at the
Ma Wan station. At each station, in-situ measurements of water quality parameters
and water samples were taken from three water depth levels of the water column
which were surface (1m below sea surface), mid-depth and bottom (1m above the
seabed).
Monitoring results are presented in Figures 35 to 38 of Annex B. Levels of DO, depth-average Turbidity and
TSS compiled with the Action and Limit Levels set in the Baseline Monitoring Report ([1])
(Tables B1 and B2 of Annex B).
1.6
Activities Scheduled for the
Next Month
Impact
Monitoring during Dredging Operations and Water Column Profiling will be conducted for CMP V in the next
monthly period. No sampling works will
be conducted for CMP IV. The sampling
schedule for the Monitoring Contract
is presented in Annex A.
1.7
Study Programme
A summary of Study programme is presented in Annex C.