
Contents
1.1 Background
1.2 Purpose of the Manual
1.3 Project Description
1.4 Objectives of the
EM&A Programme
1.5 Scope of the EM&A
Programme
1.6 Organisation and
Structure of the EM&A
1.7 Structure of the
EM&A Manual
2.1 Introduction
2.2 Environmental
Monitoring
2.3 Action and Limit
Levels
2.4 Event and Action Plan
2.5 Enquiries, Complaints,
and Requests for Information
2.6 Reporting
2.7 Cessation of EM&A
3.1 Introduction
3.2 Monitoring Activities
3.3 Monitoring for
Dredging Activities
3.4 Monitoring for
Backfilling Activities
3.5 Monitoring for Capping
Activities
3.6 Sampling Procedure for
Water Quality Monitoring
3.7 QA/QC
3.8 Data Quality
Objectives
4.1 Introduction
4.2 Objective
4.3 Hypotheses
4.4 Sampling Design
4.5 Statistical Treatment
of Data
4.6 Use of Data
4.7 Sampling Procedure and
Equipment
4.8 QA/QC
4.9 Data Quality
Objectives
5.1 Introduction
5.2 Objective
5.3 Hypothesis
5.4 Sampling Design
5.5 Statistical Treatment
of Data
5.6 Use of Data
5.7 Data Collection
Parameters
5.8 Sampling Procedure and
Equipment
5.9 QA/QC
6.1 Introduction
6.2 Objective
6.3 Hypothesis
6.4 Sampling Design
6.5 Statistical Treatment
of Data
6.6 Use of Data
6.7 Data Collection
Parameters
6.8 Sampling Procedure and
Equipment
7 Human
Health and Ecological Risk Assessment
7.1 Introduction
7.2 Objective
7.3 Hypothesis
7.4 Sampling Design
7.5 Use of Data
8.1 Introduction
8.2 Objective
8.3 Hypothesis
8.4 Sampling Design
8.5 Statistical Treatment
of Data
8.6 Use of Data
8.7 Use of Data
8.8 Benthic Micro-Infauna
and Taxonomic Identification
9.1 Introduction
9.2 Sampling Design
10 Reporting
10.1 General
10.2 Reports
Annex A Implementation
Schedule for the South Brothers Facility
Annex B Complaint
Proforma
Annex C Sampling
Programme
1
Introduction
1.1
Background
Since early 1990s,
contaminated sediment ([1])
arising from
various construction works in
The environmental
acceptability of the construction and operation of the Project had been
confirmed by findings of the associated Environmental Impact Assessment (EIA)
study completed in 2005 under Agreement
No. CE 12/2002(EP) ([3]). The Director of Environmental Protection
(DEP) approved this EIA report under the Environmental
Impact Assessment Ordinance (Cap. 499) (EIAO) in September 2005 (EIA
Register No.: AEIAR-089/2005).
In accordance with the EIA
recommendation, prior to commencement of construction works, the Civil
Engineering and Development Department (CEDD) undertook a detailed review and
update of the EIA findings for the SB site ([4])
approved, in
principle, under Agreement No. CE 12/2002(EP) and the EIAO to assess for the EIA��s relevance. Findings of the EIA review undertaken in
2009/ 2010 confirmed that the construction and operation of the SB site had
been predicted to be environmentally acceptable.
An Environmental Permit
(EP-427/2011) was issued by the Environmental Protection Department (EPD) to
the CEDD, the Permit Holder, on 3 November 2011 and varied on 23 December 2011
(EP-427/2011/A).
Under the requirements of
Condition 4 of the EP (EP-427/2011/A), an EM&A programme as set out in the
Manual is required to be implemented.
1.2
Purpose of the Manual
This Environmental
Monitoring and Audit (EM&A) Manual (��the Manual��) has been prepared by
ERM-Hong Kong, Limited (ERM) on behalf of CEDD.
The purpose of the Manual
is to provide information, guidance and instruction to personnel charged with
environmental duties and those responsible for undertaking EM&A work during
the construction and operation of the Project. It provides systematic procedures for
monitoring and auditing of potential environmental impacts that may arise from
the works.
In preparing this EM&A Manual
for the SB Facility, reference has been made to the Technical Memorandum of the Environmental Impact Assessment Process
(EIAO TM), the approved EIA Report (EIAO
Register Number: AEIAR-089/2005) and EM&A Manual for this Project ([5]), the EIA Review Report prepared
under the CEDD study Contaminated
Sediment Disposal Facility at South of Brothers (Agreement No. FM 2/2009),
and the EM&A Manual for the existing contaminated sediment disposal
facility at ESC (submitted under the Environment
Permit No. EP-312/2008/A).
1.3
Project Description
1.3.1
Project
Scope
The proposed SB Facility is
classified as a Designated Project by virtue of the following items of Item C
(Reclamation, Hydraulic and Marine Facilities, Dredging and Dumping), Part I of
Schedule 2 under EIAO:
�P
Item
C.10 �V A Marine Dumping Area; and
�P
Item
C.12 �V A dredging operation exceeding 500,000 m3.
The Project involves the
sequential dredging, disposal of contaminated mud into, and subsequent capping
of the two dredged pits. Figure 1.1 presents the location of the proposed site
at SB. The key components of the
facility include the following:
�P
Dredging
of two seabed pits (CMP 1 and CMP 2) sequentially
within the proposed SB Facility Boundary;
�P
Backfilling
each dredged pit sequentially with
contaminated mud that has been classified as requiring Type 2 disposal in
accordance with ETWB TC(W) No. 34/2002;
and
�P
Capping
each backfilled pit sequentially with
uncontaminated material effectively isolating the contaminated mud from the
surrounding marine environment.
These components constitute
the construction and operation phases of the SB CAD facility. They are the subject of the EM&A
programme.
1.3.2
Project
Programme
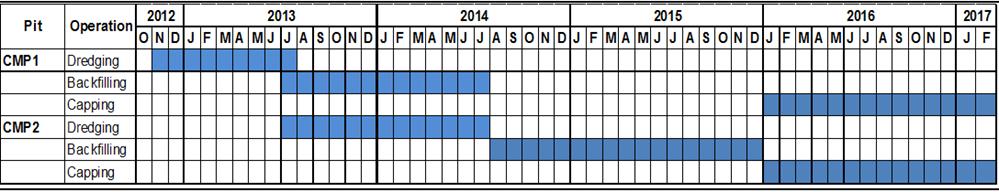
Preliminary works programme
indicate that the SB Facility will be put into service in phases in 2012. The first pit (CMP 1) is expected to be
dredged in November 2012 in order to be ready to receive contaminated mud in mid 2013. According
to arisings estimates the second pit (CMP 2) at the
SB facility will be backfilled starting in mid 2014. It should be noted that should the rate
at which contaminated mud arises change (either increasing or decreasing) then SB
CMPs may be capped earlier or later than early 2016.
The tentative project programme
is presented in Figure 1.2. It should
be noted that the timeline presents predicted timeframes for each works
component.
Figure
1.2 Indicative Works Programme at
the South of The Brothers Facility
1.4
Objectives of the
EM&A Programme
The broad objective of this
EM&A Manual is to define the procedures of the EM&A programme for
monitoring the environmental performance of the Project during construction and
operation. The construction and
operational impacts resulting from the implementation of the SB Facility are
specified in the EIA Report and the subsequent EIA Review Report. These Reports also specify mitigation
measures that need to be implemented to confirm compliance with the required
environmental criteria. These
mitigation measures and their implementation requirements are presented in the Implementation Schedule (Annex A).
The EIA recommends that
environmental monitoring will be necessary to assess the effectiveness of
measures implemented to mitigate potential water quality, marine ecology and
fisheries impacts during the construction and operation of the proposed
facility. Regular environmental auditing
is also recommended to confirm that potential impacts from other sources are
adequately addressed through the implementation of the mitigation measures
defined in the EIA/ EIA Review Reports.
The objectives of the
EM&A programme are as follows:
1) To monitor and report on
the environmental impacts of the dredging operations associated with the construction
of the disposal pits;
2) To monitor and report on
the environmental impacts due to capping operations of the exhausted pits;
3) To monitor and report on
the environmental impacts of the disposal of contaminated marine sediments in
the active pits and specifically to determine:
a.
changes/trends
caused by disposal activities in the concentrations of contaminants in
sediments adjacent to the pits;
b.
changes/trends
caused by disposal activities in the toxicity of sediment adjacent to the pits;
c.
changes/trends
caused by disposal activities in the concentrations of contaminants in tissues
of demersal marine life adjacent to and remote from
the pits;
d.
impacts
on water quality and benthic ecology caused by the disposal activities; and
e.
the risks to human health and dolphin of
eating seafood taken in the marine area around the active pits.
4) To monitor and report on
the environmental impacts of the disposal operation and specifically to
determine whether the methods of disposal are effective in reducing the risks
of adverse environmental impacts.
5) To monitor and report on
the benthic recolonisation of the capped pits and
specifically to determine the difference in infauna
between the capped pits and adjacent sites.
6) To assess the impact of a
major storm (Typhoon Signal No. 8 or above) on the containment of any uncapped
or partially capped pits.
7) To design and continually
review the operation and monitoring programme and:
a.
to
make recommendations for changes to the operation that will rectify any
unacceptable environmental impacts; and
b.
to make recommendations for changes to
the monitoring programme that will improve the ability to cost effectively
detect environmental changes caused by the disposal activities.
8) To establish numerical
decision criteria for defining impacts for each monitoring component.
9) To provide supervision on
the field works and laboratory works to be carried out by
contractors/laboratories.
The specific objectives of
each component are discussed in the relevant sections of this EM&A Manual.
1.5
Scope of the EM&A Programme
The scope of this EM&A
programme is to:
�P
Establish
baseline water quality levels at specified locations prior to dredging
operations for the construction of the SB Facility;
�P
Implement
monitoring and inspection requirements for water quality monitoring programme
during dredging, backfilling and capping of the SB Facility;
�P
Implement
monitoring and inspection requirements for sediment quality monitoring
programme during backfilling operations at the SB Facility;
�P
Implement
monitoring and inspection requirements for sediment toxicity monitoring
programme during backfilling operations at the SB Facility;
�P
Implement
monitoring and inspection requirements for the body burden (marine biota)
monitoring programme during backfilling operations at the SB Facility;
�P
Liaise
with, and provide environmental advice (as requested or when otherwise
necessary) to site staff on the comprehension and consequences of the
environmental monitoring data;
�P
Identify
and resolve environmental issues and other functions as they may arise from the
works;
�P
Check
and quantify the Contractor's overall environmental performance, implementation
of Event and Action Plans (EAPs), and remedial actions taken to mitigate
adverse environmental effects as they may arise from the works;
�P
Conduct
monthly reviews of monitored impact data as the basis for assessing compliance
with the defined criteria and to ensure that necessary mitigation measures are
identified and implemented, and to undertake additional ad hoc monitoring and auditing as required by special
circumstances;
�P
Evaluate
and interpret all environmental monitoring data to provide an early indication
should any of the environmental control measures or practices fail to achieve
the acceptable standards, and to verify the environmental impacts predicted in
the EIA;
�P
Manage
and liaise with other individuals or parties concerning other environmental
issues deemed to be relevant to the construction and operation process; and
�P
Conduct
regular site inspections of a formal or informal nature to assess:
-
the
level of the Contractor��s general environmental awareness;
-
the
Contractor��s implementation of the recommendations in the EIA;
-
the
Contractor��s performance as measured by the EM&A;
-
the
need for specific mitigation measures to be implemented or the continued usage
of those previously agreed;
-
to
advise the site staff of any identified potential environmental issues; and
-
submit regular EM&A reports which
summarise project monitoring and auditing data, with full interpretation
illustrating the acceptability or otherwise of any environmental impacts and
identification or assessment of the implementation status of agreed mitigation
measures.
1.5.1
Environmental
Management Plan (EMP)
To ensure effective
implementation and reporting on compliance with the stated mitigation measures,
as well as the monitoring and auditing requirements and remedial actions
defined in the EIA, an appropriate contractual and supervisory framework needs
to be established. The basis of the
framework within which implementation should be managed overall is through the
preparation of EMPs by the Contractor(s).
An EMP is similar in nature
to a quality plan and provides details of the means by which the Contractor
(and all subcontractors working to the Contractor) will implement the
recommended mitigation measures and achieve the environmental performance
standards defined in
The EMP also provides
opportunities for the Contractor to draw upon the strength of other
institutional processes such as ISO 9000/14000 to ensure that the achievement
of the required standards and fulfilment of commitments are documented.
The contractual requirement
for an EMP would generally comprise appropriate extracts from (and references
to) the EIA Report and EM&A Manual, and include such typical elements as
the relevant statutory environmental standards, general environmental control
clauses and specific environmental management clauses, as well as an outline of
the scope and content of the EMP. In
drafting the documentation, due consideration should be given to the predictive
nature of the EIA process and the consequent need to manage and accommodate the
actual impacts arising from the construction process. In particular, the Contractor must be
placed under a clear obligation to identify and control any implications
arising from changes to the working methods assumed in the EIA, or to the
progress rates and other estimates made during the preliminary design phase.
1.6
Organisation and Structure of the EM&A
1.6.1
Project
Organisation
The EM&A will require
the involvement of CEDD, an Environmental Team (ET), Independent Auditor(s) and
the Contractor.
The CEDD will appoint an
Environmental Team (ET) to conduct the monitoring and auditing works and to
provide specialist advice on the undertaking and implementation of
environmental responsibilities.
The ET will have previous
relevant experience with managing similarly sized EM&A programmes and the
Environmental Team Leader (ET Leader) will be a recognised environmental professional,
preferably with a minimum of seven years relevant experience in impact
assessments and impact monitoring programmes, particularly with reference to
those to the marine environment and where possible related to marine dredging /
disposal activities.
To maintain strict control
of the EM&A process, the CEDD will also appoint Independent Auditor(s) to
verify and validate the environmental performance of the Contractor and the ET.
1.6.2
Roles
& Responsibilities
The roles and
responsibilities of the various parties involved in the EM&A process are
further expanded in the following sections. The ET Leader will be responsible for,
and in charge of, the Environmental Team; and will be the person responsible
for executing the EM&A requirements.
Contractor
Reporting to the CEDD, the
Contractor will:
�P
Work
within the scope of the construction contract and other tender conditions;
�P
Provide
assistance to the ET in conducting the required environmental monitoring;
�P
Participate
in the site inspections undertaken by the ET, as required, and undertake any
corrective actions instructed by CEDD;
�P
Provide
information/advice to the ET regarding works activities which may contribute,
or be contributing to the generation of adverse environmental conditions;
�P
Implement
measures to reduce impact where Action and Limit levels are exceeded; and
�P
Take
responsibility and strictly adhere to the guidelines of the EM&A programme
and complementary protocols developed by their project staff.
Civil
Engineering and Development Department (CEDD)
The CEDD will:
�P
Monitor
the Contractor's compliance with contract specifications, including the
effective implementation and operation of environmental mitigation measures and
other aspects of the EM&A programme;
�P
Employ
Independent Auditor(s) to audit the results of the EM&A works carried out
by the ET;
�P
Comply
with the agreed Event and Action Plan in the event of any exceedance;
and
�P
Instruct
the Contractor to follow the agreed protocols or those in the Contract
Specifications in the event of exceedances or complaints.
Environmental
Team
The duties of the
Environmental Team (ET) and Environmental Team Leader (ET Leader) are to:
�P
Monitor
the various environmental parameters as required by this or subsequent
revisions to the EM&A Manual;
�P
Assess
the EM&A data and review the success of the EM&A programme determining
the adequacy of the mitigation measures implemented and the validity of the EIA
predictions as well as identify any adverse environmental impacts before they
arise;
�P
Conduct
regular site inspections and to investigate and inspect the Contractor's
equipment and work methodologies with respect to pollution control and
environmental mitigation, monitor compliance with the environmental protection
specifications in the Contract, and to anticipate environmental issues that may
require mitigation before the problem arises;
�P
Audit
the environmental monitoring data and report the status of the general site
environmental conditions and the implementation of mitigation measures
resulting from site inspections;
�P
Review
Contractor��s working programme and methodology, and comment as necessary;
�P
Investigate
and evaluate complaints, and identify corrective measures;
�P
Advice
to the Contractor on environmental improvement, awareness, enhancement matters,
etc, on site;
�P
Report
on the environmental monitoring and audit results and the wider environmental
issues and conditions to the Contractor, CEDD and the EPD; and
�P
Adhere
to the agreed protocols or those in the Contract Specifications in the event of
exceedances or complaints.
The ET will be led and
managed by the ET leader. The ET
leader will have relevant education, training, knowledge, experience and
professional qualifications subject to the approval of the Director of
Environmental Protection. Suitably
qualified staff will be included in the ET, and ET should not be in any way an
associated body of the Contractor.
Independent
Auditor(s)
�P
Review
and audit the implementation of the EM&A programme and the overall level of
environmental performance being achieved;
�P
Validate
and confirm the accuracy of monitoring results, monitoring equipment,
monitoring stations, monitoring procedures and locations of sensitive
receivers;
�P
Audit
the EIA recommendations and requirements against the status of implementation
of environmental protection measures on site;
�P
Adhere
to the procedures for carrying out complaint investigation;
�P
Review,
when required, the effectiveness of environmental mitigation measures and
project environmental performance including the proposed corrective measures;
�P
Report,
when required, the findings of audits and other environmental performance
reviews to CEDD, ET, EPD and the Contractor.
The independent auditor(s)
will have relevant education, training, knowledge, experience and professional
qualifications subject to the approval of the Director of Environmental
Protection. Independent auditor(s)
should not be in any way an associated body of the Contractor or the ET.
1.7
Structure of the
EM&A Manual
The remainder of the Manual
is set out as follows:
�P
Section
2 sets out the EM&A general requirements;
�P
Section
3 details the methodologies, parameters to be tested and the requirements for
the marine water quality monitoring for the dredging, backfilling and capping
operations at the SB Facility;
�P
Section
4 details the methodologies, parameters to be tested and the requirements for
sediment quality monitoring for the backfilling activities at the SB Facility;
�P
Section
5 details the methodologies, parameters to be tested and the requirements for
sediment toxicity quality monitoring for the backfilling activities at the SB
Facility;
�P
Section
6 details the methodologies, parameters to be tested and the requirements for
marine biota monitoring for the backfilling activities at the SB Facility;
�P
Section
7 details the requirements for Human Health and Dolphin Risk Assessment;
�P
Section
8 details the requirements for benthic re-colonisation assessment;
�P
Section
9 details the methodologies, parameters to be tested and the requirements for
the assessment of impacts due to major storms; and
�P
Section
10 details the EM&A reporting requirements.
2
EM&A General
Requirements
2.1
Introduction
In this section, the
general requirements of the EM&A programme are presented. The scope and content of the programme is
developed with reference to the findings and recommendations of the approved
EIA Report (EIA Register No.:
AEIAR-089/2005) and the EIA Review.
Potential environmental impacts
associated with the construction and operation of the Project, as identified
during the EIA process, will be addressed through monitoring and controls
specified in this EM&A Manual and in the construction contracts.
2.2
Environmental
Monitoring
During dredging and capping
operations at the SB Facility, water quality will be subject to EM&A, with
environmental monitoring being undertaken for water quality as determined in
the EIA (see Section 3 for details).
During backfilling
operations at the SB Facility, water and sediment quality, marine ecology and
fisheries will be subject to EM&A, with environmental monitoring being
undertaken for these aspects (see Sections
3 to 9 for details).
The environmental
monitoring work for this Project will be carried out in accordance with this
EM&A Manual and reported by the ET.
2.3
Action and Limit Levels
Action and Limit (A/L)
Levels are defined levels of impact recorded by the environmental monitoring
activities which represent levels at which a prescribed response is required. This processes by which these levels
should be quantitatively defined are presented in the relevant sections of this
Manual and described in principle below:
�P
Action Levels: beyond which there is a
clear indication of a deteriorating ambient environment for which appropriate
remedial actions are likely to be necessary to prevent environmental quality
from falling outside the Limit Levels,
which would be unacceptable; and
�P
Limit Levels: statutory and/or agreed
contract limits stipulated in the relevant pollution control ordinances, HKPSG
or Environmental Quality Objectives
established by the EPD. If these
are exceeded, works may not proceed without appropriate remedial action,
including a critical review of plant and working methods.
2.4
Event and Action Plan
The purpose of Event and
Action Plans (EAPs) are to provide, in association with the monitoring and
audit activities, procedures for ensuring that if any significant environmental
incident (either accidental or through inadequate implementation of mitigation
measures on the part of the Contractor) does occur, the cause will be quickly
identified and remediated, and the risk of a similar event recurring is reduced. This also applies to the exceedances of A/L criteria to be identified in the
EM&A programme.
2.5
Enquiries, Complaints,
and Requests for Information
Enquiries, complaints and
requests for information can be expected from a wide range of individuals and
organisations including members of the public, Government departments, the
press and television media and community groups.
Enquiries, complaints and
requests for information concerning the environmental effects of the Project,
irrespective of how they are received, will be reported to CEDD and directed to
the ET Leader who will set up procedures for handling, investigation and
storage of such information. The
following steps will then be followed:
1) The ET Leader will notify
CEDD of the nature of the enquiry.
2) An investigation will be
initiated to determine the validity of the complaint and to identify the source
of the problem.
3) The ET Leader will
undertake the following steps, as necessary:
a.
investigate
and identify source of the problem;
b.
if
considered necessary by CEDD undertake additional monitoring to verify the
existence and severity of the alleged complaint;
c.
liaise
with EPD to identify remedial measures;
d.
liaise
with CEDD and the Contractor to identify remedial measures;
e.
implement
the agreed mitigation measures;
f.
repeat
the monitoring to verify effectiveness of mitigation measures; and
g.
repeat review procedures to identify further
possible areas of improvement if the repeat monitoring results continue to
substantiate the complaint.
4) The outcome of the
investigation and the action taken will be documented on a complaint proforma (Annex B). A formal response to each complaint
received will be prepared by the ET Leader within a maximum of five working
days and submitted to CEDD, in order to notify the concerned person(s) that
action has been taken.
5) All enquiries which trigger
this process will be reported in the EM&A reports which will include
results of inspections undertaken by the ET Leader, and details of the measures
taken, and additional monitoring results (if deemed necessary). It should be noted that the receipt of
complaint or enquiry will not be, in itself, a sufficient reason to introduce
additional mitigation measures.
In all cases the
complainant will be notified of the findings, and audit procedures will be put
in place to ensure that the problem does not recur.
2.6
Reporting
Monthly, Quarterly and
Annual reports will be prepared by the ET and submitted to CEDD, EPD and AFCD. The reports will be prepared and
submitted within a specified period.
Additional details on reporting protocols are presented in Section 10.
2.7
Cessation of EM&A
The cessation of EM&A
programme is subject to the satisfactory completion of the EM&A Final Review Report, with approval from EPD.
3
Water Quality
3.1
Introduction
This Section provides
details of the water quality monitoring to be undertaken during the
construction and operation of the SB Facility. Water quality modelling carried out for this
Project indicates that the potential water quality impacts associated with the dredging,
backfilling and capping works will be within acceptable levels and no unacceptable
water quality impacts are expected.
However, the monitoring programme is designed to verify the predictions
of the EIA and confirm compliance with the Water Quality Objectives (WQOs).
3.2
Monitoring Activities
Water quality monitoring
for the Project can be divided into the following stages:
�P
Dredging
activities to form the pits;
�P
Backfilling
activities at active pits; and
�P
Capping
activities at backfilled pits.
Each of these is discussed in turn
below.
3.3
Monitoring for Dredging
Activities
Water quality monitoring
will be conducted during dredging of the two seabed pits at South of The Brothers. Monitoring will consist of the
collection of baseline water quality data for the purposes of the development
of Action and Limit Levels, as well as impact monitoring during dredging
activities.
3.3.1
Baseline
Monitoring Prior to Dredging Activities
Baseline
monitoring will be conducted in the vicinity of the SB Facility and in reference
areas (EPD Water Quality Monitoring Stations NM 1, 2, 3, 5 and 6) prior to the
commencement of marine dredging works in order to gather representative water
quality data for the EM&A. Locations
of the baseline monitoring stations are shown in Figure 3.1
and the coordinates are shown in Table
3.1.
The
baseline water quality monitoring will be undertaken three days per week at all
stations for four consecutive weeks prior to construction works. A sampling survey will include the
collection of all water samples and measurement of all in situ parameters during both mid-flood and mid-ebb tides at all
stations on the same day.
Monitoring works will be completed within a 4-hour window of 2 hours
before or after mid-flood and mid-ebb tides. The interval between two sampling
surveys will not be less than 36 hours.
Table 3.1 Coordinates for Water
Quality Monitoring Stations for Baseline Water Quality Monitoring for Dredging
Activities
|
Monitoring
Stations |
Easting |
Northing |
|
Far
Field Stations |
|
|
|
SB-WFA |
805787 |
827951 |
|
SB-WFB |
806066 |
816537 |
|
Mid
Field Stations |
|
|
|
SB-WMA |
813001 |
821559 |
|
SB-WMB |
818386 |
822120 |
|
Near
Field Stations |
|
|
|
SB-WNAA |
814847 |
820043 |
|
SB-WNAB |
816197 |
819911 |
|
SB-WNBA |
813999 |
819207 |
|
SB-WNBB |
815505 |
819019 |
|
Reference
Stations |
|
|
|
NM1 |
820256 |
823214 |
|
NM2 |
816015 |
823686 |
|
NM3 |
812527 |
824049 |
|
NM5 |
807707 |
827244 |
|
NM6 |
807584 |
820286 |
|
Sensitive
Receiver Stations |
|
|
|
MW1 |
823604 |
823654 |
|
THB1 |
814514 |
817932 |
|
THB2 |
815873 |
818035 |
|
WSR45C |
817431 |
820211 |
|
WSR46 |
813880 |
820973 |
Note: Coordinates are based
on
Each station will be
sampled and measurements will be taken at three depths, 1 m below the sea
surface, mid depth and 1 m above the seabed. Where the water depth is less than 6 m
the mid-depth station may be omitted.
If the water depth is less than 3 m, only the mid-depth station will be
monitored.
For in situ measurements, triplicate readings shall be made at each
water depth at each station. Triplicate
water samples shall be collected at each water depth at each station for
laboratory measurements.
The following suite of
parameters should be measured as part of the baseline monitoring:
�P
Dissolved
Oxygen (mg L-1) (in situ);
�P
Salinity
(ppt) (in situ);
�P
pH
(in situ);
�P
Turbidity
(NTU) (in situ);
�P
Temperature
(�XC) (in situ);
�P
Current
Velocity and Direction (ms-1) (in
situ);
�P
Suspended
Solids (mg L-1) (laboratory analysis);
�P
Ammonia
(mg L-1) (laboratory analysis);
�P
Total
Inorganic Nitrogen (TIN mg L-1) (laboratory analysis);
�P
5-Day
Biochemical Oxygen Demand (BOD5) (mg L-1) (laboratory analysis);
�P
Cadmium
(mg L-1) (laboratory analysis);
�P
Chromium
(mg L-1) (laboratory analysis);
�P
Copper
(mg L-1) (laboratory analysis);
�P
Lead
(mg L-1) (laboratory analysis);
�P
Mercury
(mg L-1) (laboratory analysis);
�P
Nickel
(mg L-1) (laboratory analysis);
�P
Silver
(mg L-1) (laboratory analysis);
�P
Zinc
(mg L-1) (laboratory analysis); and,
�P
Arsenic
(mg L-1) (laboratory analysis).
In addition to the water
quality parameters, other relevant data will also be measured and recorded in
Water Quality Monitoring Logs, including the location of the sampling stations,
water depth, time, weather conditions, sea conditions, tidal stage, special
phenomena and work activities undertaken around the monitoring and works area
that may influence the monitoring results.
Four hard copies and one
electronic copy of the Baseline
Monitoring Report will be submitted to the EPD at least two weeks before
commencement of construction of the Project.
3.3.2
Impact
Monitoring during Dredging Activities
Impact monitoring for the
dredging activities at SB will be conducted at mobile stations around the
dredging area. Initially, the
impact monitoring will be conducted at both mid-flood and mid-ebb tides for
three days per week. The interval
between two sets of monitoring shall normally not be less than 36 hours. The frequency of monitoring should be
reviewed based on sufficient monitoring results (e.g. from the first three
months of monitoring) to determine whether reductions can be made. Subsequent revision(s) of monitoring
frequency shall be confirmed upon agreement with the EPD.
The location of the mobile
monitoring stations is dependent on the location of the dredging
activities. These mobile stations
will be located at an appropriate distance between each other along the
up-current and down-current transect for the dredging area. The following methodology will be
adopted to determine the precise location of the mobile stations on each
sampling occasion:
�P
Contact
the CEDD barge one day before the survey day for every sampling occasion to
determine the dredging schedule for that particular survey day and to determine
the likely location of dredging at the proposed time of sampling;
�P
Determine
current direction at mid-depth at one station upstream and one station downstream
of the SB Facility during both mid-flood and mid-ebb tide;
�P
Determine
a suitable location for the station transect (the first down-current station
will be located on the down current edge, and first up-current station will be
located on the up-current edge, according to the current direction and the
position of dredging at the time of sampling); and
�P
Collect
samples from the stations located on a transect
running up-current and down-current of the dredging area.
There will be two stations
located up-current and five stations down-current of the monitoring transect. A 500 m separation distance will be
adopted between adjacent stations except between adjacent upstream and
downstream stations which are located on the pit edge. In addition, water samples will be
collected from the Sensitive Receiver stations at Sham Shui
Kok, Tai Mo To, Ma Wan and Tai Ho Bay as shown in Figures 3.2a and 3.2b. Locations of upstream and downstream
stations are illustrated in Figures 3.2a and 3.2b based on assumed current direction and dredging
position during monitoring.
Each station will be
sampled and measurements will be taken at three depths, 1 m below the sea
surface, mid depth and 1 m above the seabed. Triplicate water samples and
measurements will be taken at each depth.
Where water depth is less than 6m the mid-depth station may be omitted. If water depth is less than 3m, only the
mid-depth station will be monitored.
The following suite of
parameters should be measured as part of the impact monitoring for dredging:
�P
Dissolved
Oxygen (mg L-1) (in situ);
�P
Salinity
(ppt) (in situ);
�P
pH
(in situ);
�P
Turbidity
(NTU) (in situ);
�P
Temperature
(�XC) (in situ)
�P
Current
Velocity and Direction (ms-1) (in
situ); and,
�P
Suspended
Solids (mg L-1) (laboratory analysis).
In addition to the water
quality parameters, other relevant data will also be measured and recorded in
Water Quality Monitoring Logs, including the location of the sampling stations,
water depth, time, weather conditions, sea conditions, tidal stage, special
phenomena and work activities undertaken around the monitoring and works area
that may influence the monitoring results.
3.3.3
Water
Quality Compliance and Event & Action Plan
Impact monitoring for
dredging activities will be evaluated against Action and Limit Levels. The key assessment parameters are
dissolved oxygen (DO) and suspended sediment (SS) and thus Action and Limit
Levels based on the assessment criteria are identified for these parameters. However, turbidity can also provide
valuable instantaneous information on water quality and thus an Action Limit is
measured for this parameter to facilitate quick responsive action in the event
of any apparent unacceptable deterioration attributable to the works. Baseline data will be taken into account
in setting Action and Limit Levels, however, the rationale are shown in Table 3.2.
Action and Limit Levels are
used to determine whether operational modifications are necessary to mitigate
impacts to water quality ([6]). In the event that the levels are
exceeded, appropriate actions in Event and Action Plans (Table 3.3) should be undertaken.
Table 3.2 Action and Limit Levels of
Water Quality for Dredging Activities
|
Parameter |
Action
Level |
Limit
Level |
|
Dissolved
Oxygen |
|
|
|
Surface and Middle Depth Averaged |
The average of the impact, WSR
45C and WSR 46 station
readings are < 5%ile of baseline data and Significantly less than the reference
stations mean DO (at the same tide of the same day) |
The average of the impact, WSR
45C and WSR 46
station readings are < 4 mg/L and Significantly less than the reference
stations mean DO (at the same tide of the same day) |
|
Bottom |
The average of the impact, WSR
45C and WSR 46 station
readings are < 5%ile of baseline data and Significantly less than the reference
stations mean DO (at the same tide of the same day) |
The average of the impact, WSR
45C and WSR 46
station readings are < 2 mg/L and Significantly less than the reference
stations mean DO (at the same tide of the same day) |
|
Suspended
Solids |
|
|
|
Depth Averaged |
The average of the impact, WSR
45C and WSR 46
station readings are > 95%ile of baseline data and 120% or more of the reference stations
SS (at the same tide of the same day) |
The average of the impact, WSR
45C and WSR 46
station readings are > 99%ile of baseline data and 130% or more of the reference stations
SS (at the same tide of the same day) |
|
Turbidity |
|
|
|
Depth Averaged |
The average of the impact, WSR
45C and WSR 46
station readings are > 95%ile of baseline data and 120% or more of the reference stations
turbidity (at the same tide of the same day) |
The average of the impact, WSR
45C and WSR 46
station readings are > 99% of baseline data and 130% or more of the reference stations
turbidity (at the same tide of the same day) |
Table 3.3 Water Quality Event and
Action Plan during Dredging Operations
|
Event |
Environmental
Team |
Contractor
|
|
Action
level |
|
|
|
Exceedance for one occasion |
�P Repeat in-situ measurement to confirm findings; �P Identify the source(s) of
impact; �P Inform contractor and
contractor informs CEDD, EPD and AFCD and confirm notification of the
non-compliance in writing; �P Check monitoring data; �P Discuss potential
mitigation measures if exceedance is attributed to
the works with contractor. |
�P Discuss potential
mitigation measures with ET and agree on mitigation measures to be
implemented if exceedance is attributed to the
works; �P Ensure mitigation
measures are implemented; �P Assess the effectiveness
of the implemented mitigation measures. |
|
Limit Level
|
|
|
|
Exceedance for one occasion |
�P Repeat in-situ
measurement to confirm findings; �P Identify source(s) of
impact; �P Inform contractor and
contractor informs CEDD, EPD and AFCD; �P Discuss further
mitigation measures if exceedance is attributed to
the works with contractor; �P Increase the monitoring
frequency to daily if exceedance is attributed to
the works until no exceedance of the Limit Level. |
�P Critical review of
working methods; �P Check plant, equipment
and working methods; �P Discuss further mitigation
measures with ET to be implemented if exceedance is
attributed to the works; �P Ensure mitigation
measures are being implemented; �P Assess the effectiveness
of the implemented mitigation measures |
|
Limit Level exceeded on two or more
occasions |
�P Identify source(s) of
impact; �P Inform contractor and
contractor informs, CEDD, EPD and AFCD. |
�P If exceedance
is attributed to the works consider and if necessary reduce works until no exceedance of Limit Level |
|
Impacts attributable to works |
�P Inform contractor and contractor
informs, CEDD, EPD and AFCD. |
�P Comprehensive review of
works; �P Reduce works; and �P Suspension of works. |
3.4
Monitoring for
Backfilling Activities
3.4.1
Objective
The main objective of this
component is to determine the impacts, if any, of backfilling activities at SB
Facility on water quality. Two
separate components of water quality monitoring are necessary:
�P
Routine Water Quality
Monitoring
�V conducted to examine the impacts of backfilling activities on the level of
inorganic metal contaminants in marine waters; and
�P
Water Column Profiling �V conducted to examine in situ the impacts of backfilling
operations on water quality parameters within the water column.
3.4.2
Hypotheses
The impact hypothesis for
this work component has been defined based on the predictions from the EIA
regarding impacts from the contaminated mud disposal operations and the
objectives for the EM&A.
Backfilling
(disposal) operations do not result in any exceedances
of Northwestern Water Quality Control Zone (NWWCZ)
Water Quality Objectives (WQO).
As a consequence of
performing two separate tasks for assessing the impacts of backfilling
operations on water quality, two null hypotheses will be tested:
Routine
Water Quality Monitoring
H0 There are no differences in
the levels of contaminants in water samples in the plume arising from the backfilling
works and background levels in the vicinity of the backfilling.
Water Column
Profiling
H0 There is no change in the
level of compliance with the NWWCZ WQOs of samples taken from the plume arising
from backfilling activities (EIA predicted location).
3.4.3
Sampling
Design
Routine
Water Quality Monitoring
Routine water quality
monitoring will be undertaken during backfilling activities at mid-ebb or
mid-flood tide. Water samples will
be collected at specific stations at fixed location, which should be located in
three areas at increasing distances from the active pit (Reference,
Intermediate and Impact stations/areas).
Additional Sensitive Receiver stations at Sham Shui
Kok, Tai Mo To, Ma Wan and Tai Ho Bay will be sampled. The design for this component of the
programme allows impacts, if any, to water quality as a result of the
backfilling activities in the vicinity of SB Facility to be assessed.
The number of monitoring
stations sampled depends on the state of the tide. During the ebb tide, water samples are
collected from five up-current Reference Stations, five down-current Impact
Stations and five down-current Intermediate Stations. During the flood tide, water samples are
collected from three up-current Reference Stations, three down-current Impact
Stations and three down-current Intermediate Stations. The approach will ensure that the impact
of temporal changes on the hydrodynamic conditions in the area is considered in
the sampling.
The following suite of
parameters should be measured as part of routine water quality monitoring
operations:
�P
Dissolved
Oxygen (mg L-1) (in situ);
�P
Salinity
(ppt) (in situ);
�P
pH
(in situ);
�P
Turbidity
(NTU) (in situ);
�P
Temperature
(�XC) (in situ)
�P
Current
Velocity and Direction (ms-1) (in
situ);
�P
Suspended
Solids (mg L-1) (laboratory analysis);
�P
Ammonia
(mg L-1) (laboratory analysis);
�P
Total
Inorganic Nitrogen (TIN mg L-1) (laboratory analysis);
�P
5-Day
Biochemical Oxygen Demand (BOD5) (mg L-1) (laboratory analysis)
�P
Cadmium
(mg L-1) (laboratory analysis);
�P
Chromium
(mg L-1) (laboratory analysis);
�P
Copper
(mg L-1) (laboratory analysis);
�P
Lead
(mg L-1) (laboratory analysis);
�P
Mercury
(mg L-1) (laboratory analysis);
�P
Nickel
(mg L-1) (laboratory analysis);
�P
Silver
(mg L-1) (laboratory analysis);
�P
Zinc
(mg L-1) (laboratory analysis); and
�P
Arsenic
(mg L-1) (laboratory analysis).
In addition to the water
quality parameters, other relevant data will also be measured and recorded in
Water Quality Monitoring Logs, including the location of the sampling stations,
water depth, time, weather conditions, sea conditions, tidal stage, special
phenomena and work activities undertaken around the monitoring and works area
that may influence the monitoring results.
The locations of monitoring
stations during ebb and flood tides are shown in Figures 3.3
and 3.4, respectively, and the coordinates are shown Table 3.4. Additional monitoring stations at Sham Shui Kok, Tai Mo To, Ma Wan and
Tai Ho Bay will be sampled. Eight
replicate samples will be collected from each monitoring station, for eight
times per year, twice in the dry season, twice during the wet season and twice
in each of the two transitional seasons ([7]). The sampling frequency and number of
replicates are the same as those currently proposed for the CMP V EM&A
programme and will initially be used for SB monitoring as a consistent and
conservative approach.
For a given sampling event
water samples and in situ
measurements should be taken at mid-depth of all stations during the same tidal
state (ie mid-ebb or mid-flood tide), with the
exception of Dissolved Oxygen, Suspended Solids and Turbidity for which the
sampling/measurements should be taken at both mid-depth and bottom level of all
stations during the same tidal state.
Sampling frequency and number of replicates for the SB Facility will be
reviewed and adjusted accordingly based on power analyses in each Annual Review Report.
Routine water quality
monitoring for SB will be undertaken during its backfilling activities, which
is currently predicted to begin in July 2013. Details on the Sampling Programme are
shown in Annex C.
Table 3.4 Coordinates of Monitoring
Stations for Routine Water Quality Monitoring during Backfilling Operations and
Water Quality Monitoring during Capping Operations
|
Monitoring
Stations |
Easting |
Northing |
|
Ebb Tide |
|
|
|
Reference
Stations |
|
|
|
SB-RFE1 |
814191 |
822133 |
|
SB-RFE2 |
814532 |
822458 |
|
SB-RFE3 |
814915 |
822758 |
|
SB-RFE4 |
815356 |
823032 |
|
SB-RFE5 |
815880 |
823215 |
|
Impact
Stations |
|
|
|
SB-IPE1 |
814949 |
818257 |
|
SB-IPE2 |
815257 |
818549 |
|
SB-IPE3 |
815526 |
818888 |
|
SB-IPE4 |
815790 |
819189 |
|
SB-IPE5 |
816064 |
819615 |
|
Intermediate
Stations |
|
|
|
SB-INE1 |
812140 |
819107 |
|
SB-INE2 |
812460 |
818834 |
|
SB-INE3 |
812941 |
818337 |
|
SB-INE4 |
813230 |
818850 |
|
SB-INE5 |
812577 |
817788 |
|
Sensitive
Receiver Stations |
|
|
|
MW1 |
823603 |
823653 |
|
THB1 |
814514 |
817932 |
|
THB2 |
815873 |
818035 |
|
WSR45C |
817431 |
820211 |
|
WSR46 |
813880 |
820973 |
|
Flood Tide |
|
|
|
Reference
Stations |
|
|
|
SB-RFF1 |
815058 |
818400 |
|
SB-RFF2 |
815623 |
818964 |
|
SB-RFF3 |
816147 |
819427 |
|
Impact
Stations |
|
|
|
SB-IPF1 |
814430 |
819936 |
|
SB-IPF2 |
813887 |
819291 |
|
SB-IPF3 |
815128 |
820361 |
|
Intermediate
Stations |
|
|
|
SB-INF1 |
812902 |
822410 |
|
SB-INF2 |
814111 |
822914 |
|
SB-INF3 |
815421 |
823317 |
|
Sensitive
Receiver Stations |
|
|
|
MW1 |
823603 |
823653 |
|
THB1 |
814514 |
817932 |
|
THB2 |
815873 |
818035 |
|
WSR45C |
817431 |
820211 |
|
WSR46 |
813880 |
820973 |
Note:
Coordinates are based on
Water Column Profiling
Water column profiling will
be undertaken during backfilling activities. There are two monitoring stations for
Water Column Profiling. The two monitoring
stations will be mobile, and their locations will be dependent on the position
of the disposal barge at the time of monitoring. The two mobile monitoring stations will
be approximately 100 m upstream and downstream of the disposal area,
respectively.
The following suite of
parameters should be measured as part of the water column profiling:
�P
Salinity
(ppt) (in situ);
�P
Dissolved
Oxygen (mg L-1) (in situ);
�P
Turbidity
(NTU) (in situ);
�P
Temperature
(�XC) (in situ)
�P
Current
Velocity and Direction (m s-1) (in
situ)
�P
pH
(in situ); and
�P
Suspended
Solids (mg L-1) (laboratory analysis).
In addition to the water
quality parameters, other relevant data will also be measured and recorded in
Water Quality Monitoring Logs, including the location of the sampling stations,
water depth, time, weather conditions, sea conditions, tidal stage, special
phenomena and work activities undertaken around the monitoring and works area
that may influence the monitoring results.
Water Column Profiling will
be conducted monthly. Four
replicate samples for SS will be collected at mid-depth from each of the
monitoring stations during each sampling event. The sampling frequency and number of
replicates are the same as those currently proposed for the CMP V EM&A
programme and will initially be used for SB monitoring as a consistent and
conservative approach. During each
sampling event in situ measurements
should be taken at 1 m depth intervals through the water column for a period of
one hour at each station. All water
samples and in situ measurements
should be taken during the same tidal state (ie
mid-ebb or mid-flood tide) of a given sampling event. Sampling frequency and the number of
replicates for SB will be reviewed and adjusted accordingly based on power
analyses in each Annual Review Report. Details on the Sampling Programme for the SB Facility are shown in Annex C.
3.4.4
Water
Quality Compliance and Event & Action Plan
Routine water quality
monitoring for backfilling activities will be evaluated against Action and
Limit Levels. The key assessment
parameters are dissolved oxygen (DO) and suspended sediment (SS) and thus
Action and Limit Levels based on the assessment criteria are identified for
these parameters. However,
turbidity can also provide valuable instantaneous information on water quality
and thus an Action Limit is measured for this parameter to facilitate quick
responsive action in the event of any apparent unacceptable deterioration
attributable to the works. Baseline
data will be taken into account in setting Action and Limit levels, however,
the rationale are shown in Table 3.5.
Action and limit levels are
used to determine whether operational modifications are necessary to mitigate
impacts to water quality ([8]) ([9]). In the event that the levels are
exceeded, appropriate actions in Event and Action Plans (Table 3.6) should be undertaken.
Table 3.5 Action and Limit Levels of
Water Quality for Backfilling Activities
|
Parameter |
Action
Level |
Limit
Level |
|
Dissolved
Oxygen |
|
|
|
Surface and Middle Depth Averaged |
The average of the impact, WSR
45C and WSR 46 station
readings are < 5%ile of baseline data and Significantly less than the
reference stations mean DO (at the same tide of the same day) |
The average of the impact, WSR
45C and WSR 46
station readings are < 4 mg/L and Significantly less than the
reference stations mean DO (at the same tide of the same day) |
|
Bottom |
The average of the impact, WSR
45C and WSR 46 station
readings are < 5%ile of baseline data and Significantly less than the
reference stations mean DO (at the same tide of the same day) |
The average of the impact, WSR
45C and WSR 46
station readings are < 2 mg/L and Significantly less than the
reference stations mean DO (at the same tide of the same day) |
|
Suspended
Solids |
|
|
|
Depth Averaged |
The average of the impact, WSR
45C and WSR 46
station readings are > 95%ile of baseline data and 120% or more of the reference
stations SS (at the same tide of the same day) |
The average of the impact, WSR
45C and WSR 46
station readings are > 99%ile of baseline data and 130% or more of the reference
stations SS (at the same tide of the same day) |
|
Turbidity |
|
|
|
Depth Averaged |
The average of the impact, WSR
45C and WSR 46
station readings are > 95%ile of baseline data and 120% or more of the reference
stations turbidity (at the same tide of the same day) |
The average of the impact, WSR
45C and WSR 46
station readings are > 99% of baseline data and 130% or more of the reference
stations turbidity (at the same tide of the same day) |
Table 3.6 Water Quality Event and
Action Plan during Backfilling Operations
|
Event |
Environmental
Team |
Contractor
|
|
Action
level |
|
|
|
Exceedance for one occasion |
�P Repeat in-situ measurement to confirm
findings; �P Identify the source(s) of
impact; �P Inform contractor and
contractor informs CEDD, EPD and AFCD and confirm notification of the
non-compliance in writing; �P Check monitoring data; �P Discuss potential
mitigation measures if exceedance is attributed to
the works with contractor. |
�P Discuss potential
mitigation measures with ET and agree on mitigation measures to be
implemented if exceedance is attributed to the
works; �P Ensure mitigation
measures are implemented; �P Assess the effectiveness
of the implemented mitigation measures. |
|
Limit Level
|
|
|
|
Exceedance for one occasion |
�P Repeat in-situ
measurement to confirm findings; �P Identify source(s) of
impact; �P Inform contractor and
contractor informs CEDD, EPD and AFCD; �P Discuss further
mitigation measures if exceedance is attributed to
the works with contractor; �P Increase the monitoring
frequency to daily if exceedance is attributed to
the works until no exceedance of the Limit Level. |
�P Critical review of
working methods; �P Check plant, equipment
and working methods; �P Discuss further
mitigation measures with ET to be implemented if exceedance
is attributed to the works; �P Ensure mitigation
measures are being implemented; �P Assess the effectiveness
of the implemented mitigation measures |
|
Limit Level exceeded on two or more
occasions |
�P Identify source(s) of
impact; �P Inform contractor and
contractor informs, CEDD, EPD and AFCD. |
�P If exceedance
is attributed to the works consider and if necessary reduce works until no exceedance of Limit Level |
|
Impacts attributable to works |
�P Inform contractor and
contractor informs, CEDD, EPD and AFCD. |
�P Comprehensive review of
works; �P Reduce works; and �P Suspension of works. |
3.4.5
Statistical
Treatment of Data
Routine
Water Quality Monitoring
The hierarchy of sampling
design should allow for the application of nested analysis of variance to
statistically test any changes or trends in the dataset. Under the nested design, differences
will be tested between stations in a particular area and between the three
areas (ie Impact, Intermediate and Reference). Once a time series of data has been
gathered temporal changes in water quality parameters can be analysed for
significant differences. In
addition, the data gathered will be examined against the water quality
objectives for the NWWCZ to determine if the relevant water quality objectives
have been exceeded.
Monitoring results for
metals will be compared with the EIA predictions to verify that potential impacts
to water quality or contaminant dispersion in the plumes arising from backfilling
activities are no worse than as predicted.
Water
Column Profiling
The data gathered will be
examined graphically against the water quality objectives for the NWWCZ to
determine if the relevant water quality objectives have been exceeded for any apparent
impacts arising from the backfilling activities.
3.4.6
Use
of Data
Should increases be
detected in the level of contaminants or exceedances
of the NWWCZ WQOs be detected, a review of the other monitoring parameters will
be undertaken. This will focus on
sampling stations in the vicinity of the water quality stations where increases
are detected to see if these can be attributed to contaminant spread from the
active pits. If so, consideration
will be given to revise the facility operations plan and backfilling activities
to reduce the spread of contaminants in the plume and achieve compliance with
WQOs.
3.5
Monitoring for Capping
Activities
The design for this
component of the programme allows impacts to water quality as a result of the
overall capping activities of the SB Facility to be assessed. Replicate water samples will be
collected at specific stations, which should be located in three discrete
areas: Impact, Intermediate and Reference.
The number of monitoring stations sampled depends on the state of the
tide. During the ebb tide, water
samples will be collected from five up-current Reference Stations, five
down-current Impact Stations and five down-current Intermediate Stations. During the flood tide, water samples
will be collected at three up-current Reference Stations, three down-current
Impact Stations and three down-current Intermediate Stations.
The following suite of
parameters should be measured as part of the impact monitoring for capping
operations:
�P
Dissolved
Oxygen (mg L-1) (in situ);
�P
Salinity
(ppt) (in situ);
�P
pH
(in situ);
�P
Turbidity
(NTU) (in situ);
�P
Temperature
(�XC) (in situ)
�P
Current
Velocity and Direction (ms-1) (in
situ);
�P
Suspended
Solids (mg L-1) (laboratory analysis);
�P
Ammonia
(mg L-1) (laboratory analysis);
�P
Total
Inorganic Nitrogen (TIN mg L-1) (laboratory analysis); and
�P
5-Day
Biochemical Oxygen Demand (BOD5) (mg L-1) (laboratory analysis).
In addition to the water
quality parameters, other relevant data will also be measured and recorded in
Water Quality Monitoring Logs, including the location of the sampling stations,
water depth, time, weather conditions, sea conditions, tidal stage, special
phenomena and work activities undertaken around the monitoring and works area
that may influence the monitoring results.
The locations of stations
during ebb and flood tides for SB are the same as those proposed for Routine
Water Quality Monitoring during backfilling activities (Figures 3.3
and 3.4; Table 3.4). Additional Sensitive Receiver stations
at Sham Shui Kok, Tai Mo
To, Ma Wan and Tai Ho Bay will be sampled for both ebb and flood tides. Samples should be collected eight times
per year, twice in the dry season, twice during the wet season and twice in
each of the two transitional seasons ([10]). Three replicate water samples will be
collected from mid-depth at each monitoring station during each sampling event,
with the exception of Suspended Solids for which the sampling should be taken
at both mid-depth and bottom level at each monitoring station during each
sampling event. In addition, in situ measurements should be taken at
mid-depth and bottom level of all stations during the same tidal state (ie mid-ebb or mid-flood tide) during a sampling event. All water samples and in situ measurements should be taken
during the same tidal state (ie mid-ebb or mid-flood
tide) of a given sampling event. Sampling
will be undertaken during capping activities for SB as detailed in the Sampling Programme shown in Annex C.
The sampling frequency and
number of replicates are the same as those currently proposed for the CMP V
EM&A programme and will initially be used for SB monitoring as a consistent
and conservative approach. These
will be reviewed and adjusted accordingly based on power analyses in each Annual Review Report.
3.5.1
Water
Quality Compliance and Event & Action Plan
Routine water quality
monitoring for capping activities will be evaluated against Action and Limit
Levels. The key assessment
parameters are dissolved oxygen (DO) and suspended sediment (SS) and thus
Action and Limit Levels based on the assessment criteria are identified for
these parameters. However,
turbidity can also provide valuable instantaneous information on water quality
and thus Action and Limit Levels are measured for this parameter to facilitate
quick responsive action in the event of any apparent unacceptable deterioration
attributable to the works. Baseline
data will be taken into account in setting Action and Limit levels, however,
the rationale are shown in Table 3.7.
Action and Limit Levels are
used to determine whether operational modifications are necessary to mitigate
impacts to water quality ([11]). In the event that the levels are
exceeded, appropriate actions in Event and Action Plans (Table 3.8) should be undertaken.
Table 3.7 Action and Limit Levels of
Water Quality for Capping Activities
|
Parameter |
Action
Level |
Limit
Level |
|
Dissolved
Oxygen |
|
|
|
Surface and Middle Depth Averaged |
The average of the impact, WSR
45C and WSR 46 station
readings are < 5%ile of baseline data and Significantly less than the
reference stations mean DO (at the same tide of the same day) |
The average of the impact, WSR
45C and WSR 46
station readings are < 4 mg/L and Significantly less than the
reference stations mean DO (at the same tide of the same day) |
|
Bottom |
The average of the impact, WSR
45C and WSR 46 station
readings are < 5%ile of baseline data and Significantly less than the
reference stations mean DO (at the same tide of the same day) |
The average of the impact, WSR
45C and WSR 46
station readings are < 2 mg/L and Significantly less than the
reference stations mean DO (at the same tide of the same day) |
|
Suspended
Solids |
|
|
|
Depth Averaged |
The average of the impact, WSR
45C and WSR 46
station readings are > 95%ile of baseline data and 120% or more of the reference
stations SS (at the same tide of the same day) |
The average of the impact, WSR
45C and WSR 46
station readings are > 99%ile of baseline data and 130% or more of the reference
stations SS (at the same tide of the same day) |
|
Turbidity |
|
|
|
Depth Averaged |
The average of the impact, WSR
45C and WSR 46
station readings are > 95%ile of baseline data and 120% or more of the reference
stations turbidity (at the same tide of the same day) |
The average of the impact, WSR
45C and WSR 46
station readings are > 99% of baseline data and 130% or more of the reference
stations turbidity (at the same tide of the same day) |
Table 3.8 Water Quality Event and
Action Plan during Capping Operations
|
Event |
Environmental
Team |
Contractor
|
|
Action
level |
|
|
|
Exceedance for one occasion |
�P Repeat in-situ measurement to confirm
findings; �P Identify the source(s) of
impact; �P Inform contractor and
contractor informs CEDD, EPD and AFCD and confirm notification of the
non-compliance in writing; �P Check monitoring data; �P Discuss potential
mitigation measures if exceedance is attributed to
the works with contractor. |
�P Discuss potential
mitigation measures with ET and agree on mitigation measures to be
implemented if exceedance is attributed to the
works; �P Ensure mitigation
measures are implemented; �P Assess the effectiveness
of the implemented mitigation measures. |
|
Limit Level
|
|
|
|
Exceedance for one occasion |
�P Repeat in-situ
measurement to confirm findings; �P Identify source(s) of
impact; �P Inform contractor and
contractor informs CEDD, EPD and AFCD; �P Discuss further
mitigation measures if exceedance is attributed to
the works with contractor; �P Increase the monitoring
frequency to daily if exceedance is attributed to
the works until no exceedance of the Limit Level. |
�P Critical review of
working methods; �P Check plant, equipment
and working methods; �P Discuss further
mitigation measures with ET to be implemented if exceedance
is attributed to the works; �P Ensure mitigation
measures are being implemented; �P Assess the effectiveness
of the implemented mitigation measures |
|
Limit Level exceeded on two or more
occasions |
�P Identify source(s) of
impact; �P Inform contractor and
contractor informs, CEDD, EPD and AFCD. |
�P If exceedance
is attributed to the works consider and if necessary reduce works until no exceedance of Limit Level |
|
Impacts attributable to works |
�P Inform contractor and
contractor informs, CEDD, EPD and AFCD. |
�P Comprehensive review of
works; �P Reduce works; and �P Suspension of works. |
3.6
Sampling Procedure for Water Quality Monitoring
In
situ water
quality monitoring (salinity, temperature, current velocity and direction) will
be conducted using the equipment listed in Section
3.6.1 and following the testing protocols detailed in Section 3.6.2. In order
to ensure the reliability and quality of the data, the measuring instrument
will be calibrated prior to each sampling cruise and the probe of the measuring
instrument will be maintained at a suitable distance from the seabed to avoid
re-suspension of bottom sediments from skewing the results.
Water quality profiling
will be conducted continuously for a one-hour period from a fixed point. After deployment, the probe of the
measuring equipment will be allowed to equilibrate with the surrounding
seawater for approximately 30 seconds.
Subsequently, average readings will be taken every few seconds to
minimise sampling noise arising from the sensitivity of the equipment.
In addition to in situ water quality monitoring, water
samples will be collected in a water sampler. Samples will be stored in sealed
sampling bottles and chilled, and on completion of the survey will be
transported to the laboratory for immediate analysis. Samples not for immediate analysis will
be stored at 4 �� 2�XC.
3.6.1
Equipment
The following equipment
will be supplied and used by the contractor for the water quality monitoring:
�P
Positioning Device - Horizontal positioning
will be used and determined by a differential Global Positioning System (dGPS) with the differential signal being provided by a UHF
differential transmitter. The UHF
system should provide an accuracy of better than 3m at the 95% confidence level
to ensure the survey vessel is in the correct location before taking
measurements. The dGPS will be calibrated daily before each survey period or
results reported. And all data will
be printed and logged on disc.
�P
Electronic data logging
device - A
data logging device capable of storing measurement data will be used. The device will be able to read and store
the output from all electronic meters used for this project and will record
time and location as measured by the GPS.
�P
Dissolved Oxygen and
Temperature Measuring Equipment �V The instrument will be a portable, weatherproof
dissolved oxygen measuring instrument complete with cable, sensor,
comprehensive operation manuals, and will be operable from a DC power source. It will be capable of measuring:
dissolved oxygen levels in the range of 0 - 20 mg L-1 and 0 - 200%
saturation; and a temperature of 0 - 45 degrees Celsius. It will have a membrane electrode with
automatic temperature compensation complete with a cable of not less than 20 m
in length. Sufficient stocks of
spare electrodes and cables will be available for replacement where necessary
(for example, YSI model 59 metre, YSI 5739 probe, YSI 5795A submersible stirrer
with reel and cable or an approved similar instrument).
�P
Turbidity Measurement
Equipment
- Turbidity within the water will be measured in situ by the nephelometric method.
The instrument will be a portable, weatherproof turbidity-measuring unit
complete with cable, sensor and comprehensive operation manuals. The equipment will be operated from a DC
power source, it will have a photoelectric sensor capable of measuring
turbidity between 0 - 1000 NTU and will be complete with a cable with at least
20 m in length (Hach 2100P or an approved similar
instrument).
�P
Salinity Measurement
Instrument
- A portable salinometer capable of measuring
salinity in the range of 0 - 40 ppt will be provided
for measuring salinity of the water at each monitoring location.
�P
pH
meter �V A
portable pH meter capable of measuring a range between 0.0 and 14.0 will be
provided to measure pH in marine waters.
�P
Suspended Solid Measurement
Equipment
- A water sampler (eg Kahlsic
Water Sampler), which is a PVC cylinder (capacity not less than 2 litres) which
can be effectively sealed with latex cups at both ends, will be used for
sampling. The sampler will have a
positive latching system to keep it open and prevent premature closure until
released by a messenger when the sampler is at the selected water depth. Water samples for suspended solids
measurement will be collected in high density polythene bottles, packed in ice
(cooled to 4oC without being frozen), and delivered to the
laboratory in the same day as the samples were collected.
�P
Water Depth Gauge - A portable,
battery-operated echo sounder (Seafarer 700 or a similar approved instrument)
will be used for the determination of water depth at each designated monitoring
station. This unit will either be
hand-held or affixed to the bottom of the work boat if the same vessel is to be
used throughout the monitoring programme.
�P
Water Sampling Equipment - A water sampler,
consisting of a transparent PVC or glass cylinder of not less than two litres
which can be effectively sealed with cups at both ends, will be used (Kahlsico Water Sampler 13SWB203 or an approved similar
instrument). The water sampler will
have a positive latching system to keep it open and prevent premature closure
until released by a messenger when the sampler is at the selected water depth.
�P
Current Velocity Measuring
Equipment
�V An NE Sensortec A/S UCM-60 current meter or Valeport 108 MKIII current meter or a similar approved
instrument will be used for measuring current direction. Current velocity is measured by ADCP. Calibration of ADCP is not likely to be
necessary for these instruments as they are calibrated for the life of the
instrument.
3.6.2
Sampling/Testing
Protocol
The position of the survey
vessel will be positioned to within 3 m of the designated coordinates at each
monitoring station using a differential Global Positional System (dGPS).
All in situ monitoring instruments will be checked, calibrated and
certified by laboratory accredited under HOKLAS or any other international
accreditation scheme before use, and subsequently re-calibrated at three month
intervals throughout the stages of the water quality monitoring. Responses of sensors and electrodes will
be checked with certified standard solutions before each use.
On-site calibration of
field equipment will follow the ��Guide to
Field and On- Site Test Methods for the Analysis of Waters��, BS 1427: 2009. Sufficient stocks of spare parts will be
maintained for replacements when necessary. Backup monitoring equipment will also be
made available so that monitoring can proceed uninterrupted even when equipment
is under maintenance, calibration etc.
Water samples for SS
measurements will be collected in high density polythene bottles, packed in ice
(cooled to 4�X C without being frozen), and delivered to a HOKLAS laboratory as
soon as possible after collection.
At least two replicate
samples should be collected from each of the monitoring events for in situ measurement and lab analysis.
3.6.3
Laboratory
Procedures
Using chain of custody
forms, collected water samples will be transferred directly to laboratory for
immediate processing of suspended solids, ammonia, nutrients and BOD5. Water samples will be analysed for pH
and BOD within 4 hours of their arrival at the laboratory. All other parameters will be analysed
within 48 hours of arrival. During
this period samples will be held at 4 �� 2ºC. Prior to subjecting the sample to metals
analysis, samples will be filtered to remove solids and colloidal matter. Filtration will be accomplished using
acid washed, single-use 0.45 micron membrane filters within a maximum of 8
hours from sample collection. Where
necessary, samples will undergo further preparation involving preconcentration which allows lower method detection limits
to be achieved and removes some of the possible sources of interference.
3.7
QA/QC
3.7.1
Field
Logs
Field logs will be
maintained for all survey work, noting the date of the survey, equipment used,
survey manager and a record of all activities and observations. Field logs will be retained for the
duration of the Project and archived on completion.
In
situ
measured data will be digitally recorded from the instruments and converted
into Microsoft Excel format, or manually noted. Both disc copy and hard copy will be
retained for the file records. Any
deviation from the standard procedure will be noted in the log and the reason
for the deviation recorded. In
addition, field logs will contain notes of events or activities in the vicinity
of the monitoring location which might give rise to anomalous data being
recorded.
3.7.2
Sampling
The sampling, collection,
storage and identification procedures are described in Section 3.6 of this Manual and the monitoring team will record all
data from in situ testing and from
any analysis carried out on the boat in a Field Log. All samples will be identified with a
unique date/ time/ location/ depth/ sample type code which will be attached to
the sample container or written in indelible ink directly on the container. In order to avoid contamination of the
samples, all containers will be new and unused and of analytical grade quality. Sources of contamination will be
isolated from the working area (for example, vessel fuel and exhaust fames) and
any sample contaminated by local material (such as printed circuit boards) will
be discarded and the sampling repeated.
Low level metal analysis in seawater is easily contaminated through
inappropriate handling and sampling techniques. Site staff involved in seawater sample
collection intended for dissolved metal analysis will ensure that they wear
non-contaminating disposable gloves if they have previously been operating or
have handled metallic equipment.
3.7.3
Measurement
Procedures
All in situ monitoring instruments will be checked, calibrated and
certified and subsequently re-calibrated at three monthly intervals throughout
all stages of the water quality monitoring, or as required by the manufactures
specification. Certificate(s) of
Calibration specifying the instrument will be attached to the monitoring
reports.
3.7.4
Transport
of Samples
All samples transferred
from one sub-contractor to another will be accompanied by Chain of Custody
(COC) forms. Any missing or damaged
samples require notification to ET Leader following logging in the laboratory
QA system. The number of samples,
the parameters to be tested and the time of delivery should be clearly stated
on the COC forms to ensure that samples are analysed for the correct parameters
and suitable time is provided to the analytical laboratory for provision of
resources required in the analyses.
3.7.5
Laboratory
Procedures
For details of the
contaminants to be tested, the methods to be used, the accreditation status of
laboratory analytical methods, instruments and procedures to be used, sample preparation
information, method detection limits (MDLs), QA/QC protocols and turnaround
times, the monitoring team will refer to the previous monitoring programme for
the ESC CMPIV and CMPV. The
analytical techniques to be adopted for this Project must conform to HOKLAS (or
similar overseas) accreditation.
3.8
Data Quality
Objectives
Data Quality Objectives
(DQOs) have been developed in the previous monitoring programme for ESC CMPIV
and CMPV ([12]) ([13])
to address
precision, accuracy and analyte recovery. The monitoring team is recommended to
follow the DQOs developed for data analysis.
3.8.1
In-situ
data
As the QA/QC procedures for
the in-situ measurement of DO and Turbidity, where the difference in value
between the first and subsequent measurements at a certain depth is more than
25% of the value of the first measurement, the measurements should be discarded
and further measurements should be taken to confirm the values.
3.8.2
Inorganic
Analyses
Details of quality control
specifications for inorganic testing should be included in the updated EM&A
Manual prior to commencement of disposal activities.
Precision
Duplicates (1 in every 20
samples) will be used to monitoring the precision of the analysis. Results should be flagged for reference
when:
�P
In
water samples, for metals with a concentration >4x MDL, the duplicate
results have more than a 15% RPD
�P
For
all analytes with concentration <4x MDL, the
duplicate results will be reported as analysed and no bounds should be quoted
Accuracy
Standard and certified
reference material (CRM) will be used to monitor accuracy and precision within and between batches: Results should
be flagged for reference if:
�P
The
variation of the standard from its true value is more than �� 15% (for mercury:
�� 20%)
Recovery
Post digest spikes will be
used to determine the recovery of determinants in complex sample matrices. Results should be rejected if:
�P
Spike
recoveries are more than �� 25% from the theoretical recovery for water samples. An exceptional case would be if the
sample concentration is greater than four times the spike value, the spike may
be disregarded.
4
Sediment Quality
4.1
Introduction
In accordance with the recommendations
of the EIA for this Project, a monitoring programme examining sediment quality
will be instituted to verify the EIA predictions and confirm that there is no
build-up in contamination adjacent to the pits. Sediment chemistry has long been an
important component of monitoring programmes at the East of Sha
Chau mud disposal complex. A comprehensive list of Contaminants of
Concern (COCs) has been used since 1997, comprising eight heavy metals and one
metalloid, polycyclic aromatic hydrocarbons (PAHs), polychlorinated biphenyls
(PCBs), organochlorine pesticides (eg DDT) and Tributyltin (TBT). These contaminants (which correspond to
the list of COCs in ETWB TC(W) 34/2002 in sediments should be measured in the
present monitoring programme and changes over time and distance should also be
examined.
4.2
Objective
The main objective of this
task is to determine if there are any changes and/or trends in the
concentrations of contaminants in sediments adjacent to the pits caused by
disposal activities at the SB Facility.
This objective is most appropriately addressed through two separate but
intrinsically linked sub-tasks:
�P
Pit Specific Monitoring of
Sediment Quality
- conducted to examine near field impacts of backfilling operations at SB on
the spread of contaminants from the pits and to allow for rapid detection of
any unacceptable environmental impacts and, if necessary, changes to the
operations plan.
�P
Cumulative Impact
Monitoring of Sediment Quality - conducted to analyse the ambient conditions in the
4.3
Hypotheses
The impact hypothesis for
this task is as follows:
There
is no increase in sediment contaminant concentrations over time at individual stations
or a trend of increasing concentrations with proximity to the active pit.
As a result of the separation
of this programme into two sub-tasks, two sets of null hypotheses should be
tested:
Pit
Specific Monitoring of Sediment Quality
H0 There is no increase in
sediment contaminant concentration in the area adjacent to the pits during
contaminated mud disposal works.
Cumulative
Impact Monitoring of Sediment Quality
H0 There is no increase in
sediment contaminant concentration over time in the area of contaminated mud
disposal activity.
H0 There is no increase in
sediment contaminant concentration with proximity to the active pits.
4.4
Sampling Design
The designs for assessing
the impacts of disposal of contaminated sediment in the active pits at SB on
the sediment chemistry of remote and adjacent areas take into account the
following factors:
�P
The
null hypotheses being tested;
�P
Background
levels of contaminants in the region;
�P
Predictions
on sediment plume locations;
�P
Spatial
variability in sediment chemistry;
�P
Temporal
variability in sediment chemistry; and,
�P
Expected
statistical treatment of the data.
This EM&A Manual is an
evolving document that should be updated to maintain its relevance as the
Project progresses. This includes
the relocation of monitoring stations, if considered appropriate, to best suit
the requirements of the monitoring programme and to take into account other
work that is occurring in the direct vicinity of the active facility.
4.4.1
Data
Collection Parameters
The parameters that should
be measured in sediments collected during the two sub-tasks and the rationale
for each are given below. Some of
the contaminants listed are the "Contaminants of Concern" for which
Lower and Upper Chemical Exceedance Limits
(LCEL/UCEL) exist.
a) Total
Organic Carbon (TOC)
- an indicator of organic load and the impact on bottom layer dissolved oxygen. TOC is an important factor influencing
the chemical partitioning and toxicity of hydrophobic organic compounds such as
PAHs, PCBs and pesticides. High TOC
often infers that hydrophobic contaminants are less bioavailable;
b) Inorganic
Contaminants
- metals and metalloids present in the disposed sediments which may be bioaccumulated;
c) Polycyclic
Aromatic Hydrocarbons (PAH)
- a class of organic compounds some of which are persistent and carcinogenic. These compounds may be bioaccumulated and stored in the fatty body tissues of marine
mammals;
d) Total
Polychlorinated Biphenyls (PCB) - a class of persistent man-made chemicals which tend
to bioaccumulate through the food chain and can cause
reproductive failure and cancer;
e) Organochlorine
Pesticides (DDE & DDT)
- contaminants which are persistent, highly lipophilic (can be accumulated and
stored in fat), have high bioaccumulation and biomagnification
potential, and high toxicity to aquatic organisms;
f) Tributyltin
(TBT) (in sediment and interstitial water) �V moderately persistent toxic
compound found in marine sediments which may be bioaccumulated
and cause growth abnormalities and reproductive failure; and
g) Percentage
of Silt/Clay (% < 63�gm)
�V measured in Cumulative Impacts Monitoring only. Organic contaminants and metals bind more
readily to finer particles than coarser particles due to their larger surface
area and consequent larger number of binding sites.
4.4.2
Pit
Specific Monitoring of Sediment Quality
Pit specific monitoring of
sediment quality will be undertaken during backfilling activities. Sediment samples will be collected from
two stations in the active pit, two stations on the edge of the active pit and
two stations in close proximity to the pit. For pit specific monitoring, parameters
(a) to (f) in Section 4.4.1 will be analysed.
Sediment samples will be
collected on a monthly basis from any of the six stations shown in Figure 4.1 and Table
4.1. Locations of the six
sampling stations will be dependent on the location of the active pit and will
be adjusted accordingly. For
example, when SB CMP 1 is active, stations SB-NNAA-B, SB �VNEAA-B and SB -NPAA-B
will be monitored. Twelve
replicates of composite samples (i.e. 5 grab samples obtained using a cluster
grab) will be collected from each of the stations. The sampling frequency and number of
replicates are the same as those currently proposed for the CMP V EM&A
programme and will initially be used for SB monitoring as a consistent and
conservative approach. These will
be reviewed and adjusted accordingly based on power analyses in each Annual Review Report.
Table 4.1 Coordinates
of Pit Specific Sediment Monitoring Stations
|
Monitoring
Stations |
Easting |
Northing |
|
SB CMP 1
Active |
|
|
|
Near-Pit |
|
|
|
SB-NNAA |
813945 |
819657 |
|
SB-NNAB |
816218 |
819650 |
|
Pit-Edge |
|
|
|
SB-NEAA |
814380 |
819657 |
|
SB-NEAB |
815775 |
819650 |
|
Active-Pit |
|
|
|
SB-NPAA |
814901 |
819650 |
|
SB-NPAB |
815324 |
819650 |
|
SB CMP 2
Active |
|
|
|
Near-Pit |
|
|
|
SB-NNBA |
813580 |
819005 |
|
SB-NNBB |
815790 |
818990 |
|
Pit-Edge |
|
|
|
SB-NEBA |
814067 |
819005 |
|
SB-NEBB |
815404 |
818997 |
|
Active-Pit |
|
|
|
SB-NPBA |
814587 |
819005 |
|
SB-NPBB |
814982 |
819001 |
Note: Coordinates are based
on
4.4.3
Cumulative
Impact Monitoring of Sediment Quality
Sediment samples should be
collected from stations located in four discrete areas, with two stations in
each area. The areas should be
located at increasing distances from the disposal operations (ie. Near Field, Mid Field, Capped Pits
and Far Field). Sediment
samples should also be collected from the Ma Wan and Tai Ho Bay monitoring stations. For cumulative impacts monitoring
parameters (a) to (g) in Section 4.4.1
will be analysed.
Sediment samples will be
collected four times per year, twice during the dry season and twice during the
wet season at stations indicated on Figure 4.2 and the
coordinates are shown in Table 4.2. Twelve replicates of composite samples
(i.e. 5 grab samples obtained using a cluster grab) will be collected from each
station. The sampling frequency and
number of replicates are the same as those currently proposed for the CMP V
EM&A programme and will initially be used for SB monitoring as a consistent
and conservative approach. These will
be reviewed and adjusted accordingly based on power analyses in each Annual Review Report.
Table 4.2 Coordinates
of Cumulative Impact Sediment Monitoring Stations
|
Monitoring
Stations |
Easting |
Northing |
|
Near-field |
|
|
|
SB-RNA |
813067 |
820942 |
|
SB-RNB |
818158 |
821226 |
|
Mid-field |
|
|
|
SB-RMA |
810491 |
823152 |
|
SB-RMB |
821078 |
822747 |
|
Far-field |
|
|
|
SB-RFA |
805928 |
827614 |
|
SB-RFB |
806435 |
816662 |
|
Capped Pits |
|
|
|
SB-RCA |
809024 |
821205 |
|
SB-RCB |
809268 |
820942 |
|
Sensitive
Receiver Stations |
|
|
|
MW1 |
823603 |
823653 |
|
THB1 |
814514 |
817932 |
|
THB2 |
815873 |
818035 |
Note: Coordinates are based
on
4.5
Statistical Treatment
of Data
4.5.1
Pit
Specific Monitoring of Sediment Quality
Observed differences in the
levels of contaminants will be tested using analysis of variance (ANOVA) with
factors area and station, followed by Student Newman Keuls
(SNK) multiple comparison procedures to isolate which levels within the
factor(s) differ from others.
For all of the ANOVA
techniques performed during the monitoring programme, initial analyses should
be performed to ensure that the data complies with the specific assumptions of ANOVA. These assumptions state:
�P
the
data within and among samples must be independent of each other;
�P
the
variance within samples must be equal (tested through the use of tests such as Levene's median test); and,
�P
the data among the samples must be
normally distributed (tested through the use of tests such as the Kolgomorov-Smirnov test).
Should the data not comply
with these assumptions then appropriate transformation should be applied to the
data (eg, arc-sin for percentage data, log (x+1) for
abundance data, or rank transformation if necessary). If, after transformation, the data are
still non-compliant then non-parametric tests equivalent to ANOVA such as Kruskal-Wallis tests should be used.
4.5.2
Cumulative
Impacts of Sediment Quality
The design of the
monitoring programme should allow nested ANOVA techniques to be employed. These techniques will be used to analyse
the data at different spatial and temporal scales of replication. Statistical differences should be tested
at the following factors: between areas and between sampling times. An advantage of this sampling design is
that it removes the possibility of detecting differences simply due to inherent
variation over spatial scales in the active area and thus facilitates clearer
attribution to disposal operations.
By replicating within each area, ie by
sampling two stations in one area, any statistically significant differences
detected between areas are more likely to be due to factors other than spatial variation
(eg locations of disposal operations). This approach is now an internationally
recommended technique for use in monitoring programmes ([14]). Multidimensional scaling ordination
techniques will also be applied to the data, if deemed necessary.
4.6
Use of Data
Should significant
increases be detected in the level of contaminants in sediment samples over
time or proximity to the active pits, a review of the other monitoring
parameters should be undertaken. This
review will focus on sampling stations in the vicinity of the sediment quality
monitoring stations where increases are detected to see if these can be
attributed to contaminant migration from the active pits. Assessment of the statistical
significance of the data, confidence in the data and the presence of supporting
data from other components of the monitoring programme should be jointly
assessed. If appropriate, changes
to the operations plan should be considered.
4.7
Sampling Procedure and
Equipment
All samples should be
collected by an experienced sampling team, deployed on a survey boat equipped
with fully calibrated sampling equipment and precision navigational instruments. All vessel positioning should be
accomplished with a calibrated Differential Global Positioning System (dGPS), ensuring station location accuracy to < �� 1 m
(95% confidence), with sample position automatically logged and mapped by the
navigation computer. Where sample
stations are located in close proximity to the pit area, positioning should be
further validated by use of an echo sounder to detect whether the vessel is
within the boundaries of the pit.
At each sampling station
the top 5 cm of seabed sediment should be collected using a 5-component cluster
grab sampler which collects surface sediments with a minimal disruption to the
surface layer and is designed to work effectively in soft sediment such as
those found in the area. The
cluster grab should be deployed once at each of the stations located within
each sampling area (eg Pit-Edge). The grabs can be customised and a fine
mesh lid added, which ensures that the fine fluid sediments on the surface of
the seabed are retained in the sample.
Utilisation of this cluster sampler allows a large volume of sediment to
be collected in a single deployment.
Other similar samplers (eg Petit-ponar) collect less sediment in each deployment may have
difficulty in collecting adequate samples in soft sediments, such as those
within the study area, thereby reducing efficiency and increasing collection
time. The five-cluster grab should
be collected and combined, and the sample, labelled, double-bagged and stored
in an ice chest cooled to a temperature of 4�XC with ice packs. The sediment sampler and all other
utensils should be rinsed with seawater after each sample has been collected to
avoid cross contamination between samples.
On completion of the survey, all samples should be promptly transported,
in chilled containers, to the testing laboratory for analysis.
4.8
QA/QC
A broad range of
contaminants should be analysed in sediment samples including metals,
metalloids, PAHs, PCBs, pesticides and Tributyltin in
both sediment and interstitial water.
The method detection limits should be consistent with previous
monitoring programmes at East of Sha Chau. Other
QA/QC procedures to be implemented for marine sediment analyses include:
�P
Laboratory blanks - an analyte
free matrix to which all reagents will be added in the same volumes or
proportions as used in the standard sample preparation to monitor contamination
introduced in the laboratory (organics and inorganics);
�P
Batch duplicates - an intralaboratory
split sample randomly selected from the sample batch to monitor method
precision (intrabatch) in a given sample matrix
(inorganics only);
�P
Certified Reference
Materials
- analysis of a material with a known concentration of contamination to
determine the accuracy of results in a given matrix (inorganics only);
�P
Single Control Samples - a known,
interference-free matrix spiked with target analytes
used to monitor laboratory preparation techniques (organics only);
�P
Duplicate Control Samples - multiple single control
samples designed to monitor preparation technique reproducibility (organics).
4.9
Data Quality
Objectives
Data Quality Objectives
(DQOs) have been developed to address precision, accuracy and analyte recovery.
4.9.1
Inorganic
Analyses
Precision
Duplicates (1 in every 20
samples) should be used to monitoring the precision of the analysis. Results should be flagged for reference
when:
�P
For
all analytes, except metals, with concentration
>4x Method Detection Limit (MDL), the duplicate results have more than a 20%
Relative Percentage Deviation (RPD)
�P
In
water samples, for metals with a concentration >4x MDL, the duplicate results
have more than a 15% RPD
�P
In
sediment and biota samples, for metals with a concentration >4x MDL, the
duplicate results have more than a 25% RPD
�P
For
all analytes with concentration <4x MDL, the
duplicate results should be reported as analysed and no bounds should be quoted
Accuracy
Standard and certified
reference material (CRM) will be used to monitor accuracy and precision within
and between batches: Results should be flagged for reference if:
�P
The
variation of the standard from its true value is more than �� 15% (for mercury:
�� 20%).
Recovery
Post digest spikes should
be used to determine the recovery of determinants in complex sample matrices. Results should be rejected if:
�P
Spike
recoveries are more than �� 25% from the theoretical recovery for waters,
sediment and marine biota. An
exceptional case would be if the sample concentration is greater than four
times the spike value, the spike may be disregarded.
4.9.2
Organic
Analyses
Samples should be analysed
in lots of less than 20. In order
to measure the laboratory performance within each batch of samples, a single
control sample (SCS), a duplicate control sample (DCS) and a method blank (MB)
should be processed concurrently with the samples. A SCS or DCS consists of an interference
free control matrix that is spiked with a group of target compounds
representative of the method analytes.
Method blanks, also known
as reagent, analytical, or preparation blanks, should be analysed to assess the
level of contamination that exist in the analytical system and which might lead
to the reporting of elevated concentration levels or false positive data. For organic analyses, the concentration
of target analytes in the blank must be below the
reporting limit for that analyte in order for the
blank to be considered acceptable.
Accuracy is expressed as
the average percent recovery for the SCS and
precision is expressed as the relative percent
difference (RPD) for the DCS pair. For
control limits that are not established due to insufficient data sets, the QC
Acceptance Criteria of US EPA Method 8080 and 8270A should be used as a
supplement. Once enough data are
collected, the in-house control limits should then be calculated.
The accuracy and precision
data for SCS and DCS should be evaluated against laboratory established control
limits. QC results falling outside
the control limits should be automatically flagged. The acceptance criterion is that 100 percent of the precision and accuracy values must fall
within the control limits. If this
criterion is not met, corrective action must be taken. This may include repeat sample analysis.
The average percent recovery of the SCS should be compared to the limit
set for each compound being monitored (Table 4.3). For DCS, an RPD of less than 20% is
deemed to be acceptable in normal instances.
For multianalyte
organic tests, if greater than 20% of the accuracy or precision results for the
SCS/DCS are outside of the control limits, the data are considered suspect and
the samples associated with the unacceptable DCS are reprepared
and/or reanalysed.
Table 4.3 Quality
Control Acceptance Criteria for Organics Analyses
|
Target Analytes |
Percent Recovery Measured |
|
Naphthalene |
74 - 126 |
|
Acenaphthalene |
69 - 125 |
|
Acenaphthene |
73 - 119 |
|
Fluorene |
81 - 129 |
|
Phenanthrene |
74 - 131 |
|
Anthracene |
63 - 116 |
|
Fluoranthene |
73 - 134 |
|
Pyrene |
59 - 129 |
|
Benzo(a)anthracene |
77 - 136 |
|
Chrysene |
53 - 130 |
|
Benzo(a)pyrene |
51 - 103 |
|
Dibenzo(a,h)anthracene |
78 - 126 |
|
DDE |
73 - 121 |
|
DDT |
87 - 120 |
|
Total PCBs |
79 - 127 |
|
Tributyltin |
80 - 115 |
Results must be greater
than zero
5
Sediment Toxicity
5.1
Introduction
The ecotoxicological
testing programme will feature a suite of tests that include three phylogenetically distinct species that interact with bedded
sediments in different ways. Unacceptable
impacts may have occurred if the levels of contaminants in the sediments
collected in the adjacent area of the active pits are shown to have caused
toxicity to marine fauna. The
findings of the sediment toxicity tests will be compared to the results of the
sediments chemistry.
5.2
Objective
The objective of this task
is to determine if there are any changes and/or trends caused by backfilling activities
in the toxicity of sediments adjacent to the pits as a result of backfilling activities.
5.3
Hypothesis
In accordance with the
objectives of this EM&A programme, the impact hypothesis for this task will
be as follows:
There
is no increase in sediment toxicity over time at individual stations or a trend
of increasing toxicity with proximity to the pit.
The null hypothesis which
should be statistically tested is as follows:
H0 There are no differences in
the toxicity of sediments collected at stations adjacent to the active pits
when compared with reference sediments.
5.4
Sampling Design
In order to determine whether
contaminated sediment placed in the active pit represents an ecological risk to
biota in areas adjacent to the mud pit, ecotoxicological
evaluations will be performed on sediment collected from these surrounding
areas.
The toxicological testing
programme should feature a suite of tests that includes phylogenetically
distinct species which interact with sediments in different ways. The testing programme will include
whole-sediment, or solid-phase toxicity tests. The following three international
species should be tested:
�P
Burrowing
amphipod (Leptocheirus plumulosus, Ampelisca abdita, Eohaustorius estuarius or
other equivalent species);
�P
Burrowing
polychaete (Neanthes arenaceodentata or other equivalent species); and,
�P
Free
swimming larvae of bivalves (Crassostrea gigas, Mytilus spp. or other equivalent species).
In addition, two of the
following local species should also be tested:
�P
Amphipod
Melita longidactyla;
�P
Polychaete Capitella capitata;
�P
Juvenile
shrimp Metapenaeus ensis or Penaeus (Litopenaeus) vannamei; and,
�P
Barnacle
larvae Balanus amphitrite.
The experimental designs for assessing
the impacts of disposal of contaminated sediment at SB on the toxicity of
sediments in remote and adjacent areas take into account the following factors:
�P
The
null hypotheses being tested;
�P
Location
of other potential sources of contaminants in the North Lantau
region, eg,
�P
Predictions
taken from the EIA on sediment plume locations; and,
�P
Expected
statistical treatment of the data.
Once the pit is active (ie receiving contaminated sediment), sediment toxicity
testing will be performed only when the level(s) of sediment contaminant(s) in
the Near-field station(s) exceed the LCELs as measured by the Cumulative Impact Monitoring of Sediment
Quality. Monitoring stations will
be sampled not more than twice per year (once in each of the wet and dry
seasons).
Sediment samples will be
collected from two treatment areas as well as at the Ma Wan and Tai Ho Bay stations. The first treatment area is represented
by samples taken from two stations in an area close to the active pits
(Near-Field) and the second treatment area is represented by samples collected
from stations in a reference area (Far-Field). The locations of stations are shown in Figure 5.1 and the coordinates are presented in Table 5.1. Five replicates of composite samples
will be collected from each of the stations and used for the sediment toxicity
tests. The sampling frequency and
number of replicates are the same as those currently proposed for the CMP V
EM&A programme and will initially be used for SB monitoring as a consistent
and conservative approach. These
will be reviewed and adjusted accordingly based on power analyses in each Annual Review Report. In addition, locations of sampling
stations will be amended based on location of the active pit.
Table 5.1 Sediment Toxicity Testing
Sampling Stations
|
Station |
Easting |
Northing |
|
SB CMP 1
Active |
|
|
|
Reference |
|
|
|
SB-TRA |
806358 |
827343 |
|
SB-TRB |
806465 |
816513 |
|
Near-Field |
|
|
|
SB-TAA |
814685 |
820017 |
|
SB-TAB |
815797 |
819269 |
|
Sensitive
Receiver Stations |
|
|
|
MW1 |
823603 |
823653 |
|
THB1 |
814514 |
817932 |
|
THB2 |
815873 |
818035 |
|
SB CMP 2
Active |
|
|
|
Reference |
|
|
|
SB-TRA |
806358 |
827343 |
|
SB-TRB |
806465 |
816513 |
|
Near-Field |
|
|
|
SB-TBA |
813954 |
819131 |
|
SB-TBB |
814960 |
818327 |
|
Sensitive
Receiver Stations |
|
|
|
MW1 |
823603 |
823653 |
|
THB1 |
814514 |
817932 |
|
THB2 |
815873 |
818035 |
Note: Coordinates are based
on
5.5
Statistical Treatment
of Data
Each of the toxicological
tests will be evaluated for statistically significant increases in toxicity. Statistically significant toxicity will
be determined by performing an analysis of variance (ANOVA) test that compares
the responses observed in the test treatments with those of the reference treatments. At the end of the monitoring programme
changes in the toxicity of the sediments over time will be evaluated through
the use of ANOVA incorporating both spatial and temporal scales of variation.
5.6
Use of Data
Once the data have been
evaluated for significance, it is important to identify potential causes of
toxicity and the biological significance of the observed effects. The cause of the observed effects needs
to be distinguished between 1) non-persistent contaminants, 2) persistent
contaminants, and 3) physical factors.
It is most important to determine if the cause of the toxicity is due to
persistent contaminants that are derived from the contaminated sediment placed
in the pits (eg metals, pesticides, PAHs, TBT), to
non-persistent contaminants (eg sulfides,
ammonia, salinity) or to physical factors (eg grain
size).
If the toxicity is due to
persistent contaminants that are associated with disposal operations, the
operations plan for the active pits may not be effective enough at managing the
containment of contaminated sediment to acceptable levels and thus should be
modified. If the observed toxicity
is due to non-persistent contaminants, the effects may be due to the pit but
they are transient. The toxicity of
these types of contaminants can be assimilated by the environment in relatively
short time periods, and are thus less harmful. If the effects are related to physical
factors, they are again of less concern and would not likely require changes in
the facility operations plan.
As non-contaminant factors
and physical factors can confound toxicity test interpretation, the ET will
monitor ammonia, sulfides, interstitial salinity, and
sediment-grain size. Each of these
factors has been observed to elicit a toxic response in test organisms,
however, they are not factors related to persistent contaminants of concern. This information will be used to
investigate any observed toxicity responses and determine whether the response
is due to persistent contaminants or to more transient factors.
5.7
Data Collection
Parameters
The amphipod toxicity test
with burrowing amphipod (Leptocheirus plumulosus, Ampelisca abdita, Eohaustorius estuarius or
other equivalent species as agreed with EPD/AFCD prior to conduct of the
toxicity test) will evaluate survival following a 10-day exposure to test
sediment. Procedures will follow
those outlined in PSEP (1995) ([15])
and/or USEPA
(1994) ([16]), depending on the species
used for the test, and CEDD's Environmental Laboratory Guidance Document
(1996) ([17]). The amphipod test will be conducted as a
static test and will be performed with 175 ml of sediment and 800 ml of
overlying seawater placed in a 1-L glass jar. At test initiation, each of five
replicate test chambers will be seeded with 20 amphipods. Test chambers will be maintained at 20�XC
and will be checked daily throughout the test to establish trends in sediment
avoidance. After the 10-day
exposure, the benthic tests will be terminated by sieving the sediments and
enumerating the live and dead amphipods.
The test on Neanthes arenaceodentata
(or an equivalent species as agreed with EPD/AFCD prior to conduct of the
toxicity test) will evaluate polychaete survival and
growth following a 20-day exposure to test sediment. Test methods will follow those outlined
in PSEP (1995) ([18]). The test will be conducted as a static
test, performed in 175 ml of sediment and 800 ml of overlying seawater in 1-L
glass jars. At test initiation,
each of five replicate test chambers will be seeded with five polychaetes. Test
chambers will be maintained at 20�XC and will be checked daily to record
mortality and sediment avoidance. To
promote growth, worms will be fed TetraMarin every
third day throughout the test. After
20 days, the N. arenaceodentata
test will be terminated by sieving each test chamber and enumerating both live
and dead organisms. Surviving polychaetes will be dried and weighed for each test chamber. Average dry weight will be compared to
initial biomass to determine mean growth for each test chamber.
The larval-development
toxicity test will be performed with fertilized bivalve embryos (Crassostrea gigas, Mytilus spp. or a equivalent
species as agreed with EPD/AFCD prior to conduct of the toxicity test) will
evaluate larval survival and development following a 48 to 96-hour exposure to
test sediments. This procedure will
follow those outlined in PSEP (1995) ([19]). This test will be conducted in 20 mg of
test sediment with 800 ml of seawater in 1-L glass jars. At test initiation, test jars will be
seeded with 20 to 40 embryos per ml.
Test chambers will be maintained at 16�XC. At termination, overlying water will be
decanted and subsamples drawn from the supernatant. Survival and normal larval development
will then be determined under an inverted compound microscope.
In
each of the sediment tests, a sediment/seawater control (consisting of clean
sediment for amphipod and polychaete or clean
seawater for the bivalve larval test) will be tested concurrently with the test
sediments. The control treatment
should be included to determine the health of the test organisms. Sediments collected from the reference
stations will also be tested concurrently with test sediments to provide a
basis for statistical comparison. For
the larval tests, grain-size controls will be tested concurrently with the test
sediments to discern any effects related to sediment grain size. Additionally, a water-only reference
toxicant test using cadmium (from CdCl2) or copper (from CuNO3)
will be conducted with each batch of test organisms. This reference-toxicant test provides a
measure of relative sensitivity for each group of test organisms. All toxicity tests will be completed and
reported within four months from collection of the samples.
5.8
Sampling Procedure and
Equipment
Procedures for sampling
will be as for the sediment chemistry for Sediment Quality Monitoring as
detailed in Section 4.7 of this
Manual. Shipments of the sediments
will be packaged in ice-boxes in order to maintain the sediments at a constant
temperature of 4oC and dispatched by express courier for immediate
testing.
5.9
QA/QC
To ensure the quality and
integrity of the ecotoxicological data and subsequent
analyses, a QA/QC control program will be followed that meets or exceeds the
QA/QC program outlined in Chapter 4 of CEDD's Environmental Laboratory Guidance
Document (1996). The QA/QC program
for the facility ecotoxicological program is
described below.
5.9.1
Sediment
Handling and Chain-of-Custody
Upon sample receipt,
samples will be held at 4�X �� 2�X C in the dark until required for testing. Sediment holding times for biological
testing begin the day of sample collection and will be kept at a minimum. The holding time for sediment intended
for biological testing will be eight weeks. Chain-of custody forms will accompany
each batch of samples to track samples and to provide temperature data before
and after shipping.
5.9.2
Bioassay
Seawater
Clean seawater for holding
test organisms will be sand-filtered seawater piped directly into the testing
laboratory. Seawater used for test
water and control water should be additionally gravity-feed filtered through a
0.45 micron filter before use for all test species. Bioassay seawater should be continually
monitored for water quality and the presence of algal blooms.
5.9.3
Instrument
Maintenance and Calibration
Procedures for calibration
and maintenance of water quality equipment will follow Measurement Standards
Laboratory (MSL) protocols. All
measuring and testing equipment used on this Project should be traceable to the
data collected and should be calibrated before use.
The pH meters used for
obtaining water quality data must be calibrated daily before use according to
MSL-M-045, Calibration and Use of pH Meters. The calibration will be documented on
the pH Meter Calibration Record sheet.
Maintenance on pH meters will be performed monthly. Maintenance should include visual
inspection, cleaning probes in 0.1 M HCl, and
cleaning any corroded contacts.
Refractometers used for obtaining water
quality data will be calibrated monthly using IAPO Standard Seawater according
to MSL-M-048, Calibration and Use of Refractometers. The calibration should be documented on
the Refractometer Calibration Record sheet. Refractometers
should be inspected visually and cleaned monthly.
Digital thermometer
calibrations will be performed monthly by comparison to a certified mercury
thermometer as specified in MSL-M-047, Calibration and Use of Thermometers. The calibration will be documented on a
Thermometer Calibration Record. Maintenance
should include visual inspection and cleaning of salt and corrosion from
connectors and contacts.
Dissolved oxygen meters
should be calibrated daily before use according to MSL-M-046, Calibration and
Use of Dissolved Oxygen Meters. The
calibration should be documented on the Dissolved Oxygen Meter Calibration
Record. Maintenance should be
performed once monthly and should include visual inspection, cleaning the
probe, and replacing of probe membrane.
The Fisher Accumet 1003 pH/selective ion electrode meter with ammonia
electrode should be maintained according to manufacturer��s instructions. The meter should be calibrated on each
day of use with three concentrations of NH4Cl standards bracketing
the expected test concentrations of ammonia. The ammonia probe should be stored in
0.02 M NH4Cl when not in use.
5.9.4
Data
Review and Validation
In addition to QA/QC
mentioned above, a series of reviews by qualified laboratory personnel should
be implemented to ensure that the data generated for this Project meets the
data quality objectives. These reviews
should include the following:
�P
Data
should be reviewed periodically by laboratory personnel to ensure that sample
testing activities are completely and adequately documented.
�P
Sample
holding times, sample integrity, test animal handling and acclimation,
equipment calibration, water quality measurements, reference toxicity results,
observations, and control survival will be reviewed by qualified laboratory
personnel. The results of QC
measurements will be compared to pre-established criteria as a measure of data
acceptability.
�P
A
final data audit by the Quality Assurance Officer will be performed prior to
submission of the data and report. This
audit will ensure that the data are accurate, traceable, defensible, and
complete, as compared to the Manual. The audit procedure (MSL-Q-005, Quality
Assurance Data Audits) is a statistical, randomized check which involves
comparing selected reported values to the original data. This procedure is designed to ensure a
95 percent chance of detecting whether one percent or more reported values disagree with the original
data.
The overall quality assurance
objective for this Project is to implement procedures that will ensure the
collection of representative data that is of acceptable and defensible quality. The data quality objectives for the ecotoxicological tests will be devised with reference to
the previous data quality objectives established for the previous monitoring
programmes for the East of Sha Chau
CMPs.
A negative control provides a measure
of test organism health. Negative
control treatment will be running concurrent to each toxicity test as a measure
of the test organism's health. For
the amphipod (eg Ampelisca sp.) and polychaete (eg
Neanthes sp.) toxicity tests, the negative
control should consist of clean, native sediment that is to be collected from
the test organism's natural habitat.
For the bivalve larval test, the negative control should consist of
clean seawater. Acceptable limits
for the negative controls will be defined with reference to the limits
established for the East of Sha Chau
CMP monitoring programmes. If
survival or normal development do not meet the acceptability criteria, all data
should be evaluated and the test may need to be repeated.
Water quality measurements provide
documentation of environmental conditions within the test chambers during the
exposure. Temperature, dissolved
oxygen, pH, and salinity will be measured daily throughout the test. Conditions that are acceptable to
maintain the health of the test organisms will be defined with reference to the
acceptable conditions defined for the East of Sha Chau CMP monitoring programmes. If test conditions are outside the
acceptability criteria, the data will need to be qualified.
The positive control provides a
relative measure of test organism sensitivity. For each of the bioassays for the active
pits, a separate reference-toxicant test should be performed with each batch of
test organisms. The results of the
reference-toxicant tests will be compared with control charts generated by the
testing laboratory for that species and toxicant. Those results within two standard
deviations of the cumulative mean are considered to be similar in sensitivity
to previous test populations. For
amphipods (eg A.
abdita) the reference-toxicant test will be
performed with cadmium in the form of cadmium chloride (CdCl2); for polychaetes (eg N. arenaceodentata)
and bivalve larvae reference-toxicant tests will be performed with copper as
copper nitrate (CuNO3). If
the test results are outside the control limits, the data will need to be
qualified.
6
Marine Biota
6.1
Introduction
The bioaccumulation of
contaminants by prey organisms and consequent biomagnification
of contaminants up the food chain has long been an issue of concern for the
disposal of contaminated sediment at East of Sha Chau. Although the
public at large may not appreciate the technical details of a biomonitoring programme, especially concerning mobile
populations, they are well aware of the potential for contaminated sediment disposal
to taint seafood products. In recognition
of these issues, a comprehensive biomonitoring
programme which will address public concerns about contamination of seafood in
the area through use of the data in a risk assessment framework should be
undertaken for the backfilling activities at the active pits.
6.2
Objective
As well as examining the
influence of contaminated sediment disposal on contaminant levels in demersal fisheries resources, the impact of disposal on the
abundance and structure of demersal fisheries should
also be assessed. Consequently,
there are two objectives for this task:
�P
Biomonitoring
of Contaminants
- To identify any increases in the concentrations of contaminants in tissues
and whole body burdens of demersal marine life
adjacent to and remote from the active pits.
�P
Trawling, Sorting &
Analysis -
To assess the impact of contaminated sediment disposal at the active pits on
the fisheries resources of the
6.3
Hypothesis
In accordance with the
predictions of the EIA and the objectives for this EM&A programme, the
impact hypothesis for this task is as follows:
There
is no increase in tissue or whole body contaminant concentration over time in
selected target species.
In order to reflect the
dual workstreams under this task, two sets of null
hypotheses should be tested:
Biomonitoring
of Contaminants
H0
The concentrations of
contaminants in tissue and whole body samples of demersal
marine life adjacent to the active pits are not greater than contaminant
concentrations from samples collected at stations remote from the active pits.
H0
The concentrations of
contaminants in tissue and whole body samples of demersal
marine life do not increase over time.
Trawling,
Sorting & Analysis
H0
There are no differences in
the composition or abundance of demersal fisheries
resources near to and remote from the active pits.
H0
There are no differences in
the composition or abundance of demersal fisheries
resources over time.
6.4
Sampling Design
6.4.1
Biomonitoring of Contaminants
Samples for biomonitoring of contaminants will be selected from trawl
samples described in Section 6.4.2. Samples of the target species should be
collected twice per year (July/August in the wet season and January/February in
the dry seasons) specifically from six stations. The reference stations will comprise of
two stations located near Lung Kwu Chau and two stations to the south west of the airport (Figure 6.1).
These reference stations are the same as those sampled in the ongoing monitoring programme (Agreements No. CE 64/99,
CE 19/2004 and CE 4/2009(EP)). The other two stations will be impact
stations, located on the edge of active pits. However, in order to obtain sufficient
tissue and whole body samples from impact and reference stations, samples
collected at different impact and reference stations will be combined where
necessary.
Due to concerns regarding
the collection of sufficient quantities of target species, catch from the first
trawl survey of each season (trawl for catch characterisation) should be
retained in a frozen state for joint processing with the biomonitoring
samples in the following month.
Five replicate tows (each
with six nets) should be conducted at each station and composite samples
prepared from all nets and tows at each station during each of the sampling
events. Replicate data points
should be obtained whenever the abundance of target species allows laboratory
analysis of more than one tissue/whole body sample for each target species at
each station. The design to be
developed should address the following key issues:
�P
Rigour
of the dataset to allow for statistical testing of observed differences;
�P
Data
required for the risk assessment;
�P
Composite
samples to minimise the variance between fish and improve the reliability of
detecting any significant trends; and,
�P
Analysing
replicate samples, whenever possible, to provide cost effective statistical
rigour.
The locations of biota
monitoring stations are shown in Figure 6.1 and the
coordinates are shown Table 6.1.
Details on the Sampling Programme
are shown in Annex C.
The sampling frequency and number of replicates are the same as those
currently proposed for the CMP V EM&A programme and will initially be used
for SB monitoring as a consistent and conservative approach.
Table 6.1 Demersal Trawl Sampling Station Coordinates (Center of the transect)
|
Station |
Easting |
Northing |
|
Impact |
|
|
|
SB-INA |
814304 |
819813 |
|
SB-INB |
814052 |
818459 |
|
Reference
North |
|
|
|
TNA |
806627 |
827674 |
|
TNB |
807040 |
825248 |
|
Reference
South |
|
|
|
TSA |
806366 |
816977 |
|
TSB |
805796 |
815951 |
Note: Coordinates are based
on
6.4.2
Trawling
Sorting & Analysis
The design of the sampling
programme should encompass the following key issues:
�P
Temporal
variation in fisheries assemblages; and,
�P
Spatial
variation of mobile assemblages of demersal fisheries
resources.
Samples should be collected for
analysis four times each year (twice in the dry season and twice in the wet
season) to account for temporal variation in the fisheries assemblages. The samples should be collected from 5
replicate trawls (each with 6 nets) undertaken along a
transect at each of the six stations, in which two stations are located
at the impact area while four stations are located at the two reference areas (Figure 6.1).
The sampling frequency and number of replicates are the same as those
currently proposed for the CMP V EM&A programme and will initially be used
for SB monitoring as a consistent and conservative approach. Samples for biomonitoring
of contaminants will be selected from the trawl samples.
6.5
Statistical Treatment
of Data
6.5.1
Biomonitoring of Contaminants
The data should be analysed
using analysis of variance (ANOVA) techniques to test for differences between
the two sampling sites (Impact and Reference). Once a time series of data (sequential
sampling events) has been gathered, differences should be tested between sites
and between the different sampling events to examine any temporal trends in
contaminant levels in the target species.
6.5.2
Trawling,
Sorting and Analysis
Catch composition should be
analysed using analysis of variance (ANOVA) techniques to account for changes
in catches between and within sites in the
6.6
Use of Data
If significant increases
are detected in the levels of contaminants in fisheries resources in this
programme it will indicate that bioaccumulation is occurring. However, as demersal fisheries resources are generally mobile (except
burrowing species such as the gobies Trypauchen and Oxyurichthys), increases may not necessarily be due to backfilling
at the SB Facility. Other
contaminant sources such as discharges from the Pearl River, local sewage
outfalls or non-point source pollution may cause such increases. To account for these confounding
effects, the results from this Project��s sediment and water quality monitoring
programmes along with the most recent sediment toxicity test results will be
examined so that the sources of any increases can be identified. Should there be evidence that effects
are due to the active facility, the monitoring and disposal programmes will be
reviewed and revised where necessary as agreed with CEDD and the EPD.
6.7
Data Collection
Parameters
6.7.1
Biomonitoring of Contaminants
The contaminants of concern
for this Project should be measured separately, firstly in tissue samples (soft
tissue) and secondly in whole body samples obtained from the species list
established for this project. The
species to be examined should be chosen based on two criteria:
�P
The
degree to which the organisms are exposed to contaminants in the sediments; and
�P
The
position of the organisms in the food chain and the trophic level of their
predators (ie, humans or Indo-Pacific Humpback
Dolphin).
The species list (Table 6.3) has been devised with
reference to the previous biomonitoring programmes
for the East of Sha Chau
CMP��s. Comparing to the monitoring
programme from February 2006 to April 2009, the analysis of whole body samples
of Cephalopods is suggested to be removed from the present monitoring programme
as according to Jefferson and Hung (2004) ([20]), there is little evidence
that Indo-Pacific Humpback Dolphin consumed Cephalopods as a major prey item. Therefore, it is considered unnecessary
to analyse Cephalopods for the risk assessment of Indo-Pacific Humpback Dolphin
(please refer to Section 7 for
details of risk assessment).
Table 6.2 List of Target Species for
Tissue and Whole Body Analysis
|
Type |
Tissue
Analysis Target Taxon |
Alternative
Taxon |
Whole Body
Analysis Target Taxon |
Alternative
Taxon |
|
Prawn |
Metapenaeus
ensis |
Metapenaeus joyneri |
Metapenaeus
spp. |
Metapenaeopsis spp. |
|
|
Metapenaeus Affinis |
Metapenaeopsis spp. |
|
|
|
Mantis Shrimp |
Oratosquilla oratoria |
Oratosquillina
interrupta Miyakea
nepa |
Oratosquilla
spp. |
Oratosquillina
spp. |
|
Swimming Crab |
Charybdis cruciata |
Portunus sanguinolentus |
|
|
|
|
|
Scylla serrata |
|
|
|
|
|
Portunus
pelagicus |
|
|
|
|
|
Portunus Trituberculatus |
|
|
|
Flat Fish |
Cynoglossus macrolepidotus |
Cynoglossus trigrammus and Solea
ovate |
|
|
|
Burrowing Fish |
Trypauchen
vagina |
Oxyurichthys Tentacularis |
|
|
|
Demersal/Pelagic Fish |
Leiognathus brevirostris |
Collichthys
lucida |
Leiognathus
spp. |
|
|
|
|
|
Collichthys
lucida |
Johnius
belengeri |
|
|
|
|
|
Other Sciaenidae |
|
Gastropod |
Turritella
terbra |
|
|
|
|
Non-Commercial Crab |
|
|
Charybdis spp. |
|
Note:
�P
In
case sufficient samples of the target species cannot be obtained, analysis of
the alternative species should be carried out.
�P
The
alternative species are listed in order of priority.
In the laboratory, each
trawl sample should be sorted for target species and target species selection
should be based on the abundance and potential sample mass available for each
species captured. In preparing
composite samples for analysis, different species will not be mixed. Each composite sample for laboratory
analysis should consist of three or more organisms, with priority given to
larger individuals with no more than 2 fold difference in length. Length and weight of all individual
organisms represented by the composite sample will be recorded and individuals
for tissue sample analysis dissected with a sterilised (with hexane) titanium
knife and a composite sample prepared.
Care should be taken not to cross contaminate any tissue samples with
gut contents. For fish, the axial
muscle should be extracted for analysis.
For prawn/shrimp and crab, abdominal and claw/leg muscle should be used,
respectively. For gastropods,
tissue samples should be taken from the soft body tissue.
The analytical parameters
for tissue and whole body testing are given below:
�P
Inorganic
Arsenic;
�P
Cadmium;
�P
Chromium;
�P
Copper;
�P
Lead;
�P
Mercury
�P
Nickel;
�P
Silver;
�P
Zinc;
�P
Total
Polychlorinated Biphenyls (PCBs);
�P
Organochlorine Pesticides (DDE &
DDT);
�P
Tributyltin (TBT);
�P
Polycyclic
Aromatic Hydrocarbons (PAHs); and,
�P
Moisture
content.
For each of the target taxon a total
of five replicates (i.e. composite samples) from each station should be analysed
for each analytical parameter for tissue and whole body analysis, respectively. The number of replicates is the same as
those currently proposed for the CMP V EM&A programme and will initially be
used for SB monitoring as a consistent and conservative approach. It will be reviewed and adjusted
accordingly based on power analyses in each Annual
Review Report.
Tissue
Pooling and Preparation
In the event when
insufficient biota are collected in the trawl samples for chemical analysis of
contaminants. Samples may be pooled
using the procedures shown in Table 6.3
and in the text below. It may be
noted that inter-seasonal pooling is not permitted.
Table 6.3 Methodology
for Pooling Samples to Obtain Sufficient Tissue/Whole Body
|
# |
Step
Stations to Be Combined |
Decision Criteria |
|
1 |
Impact (INA) + Impact (INB) = Impact Reference (TNA) + Reference (TNB) =
Reference |
Proceed to step 2 unless tissue and whole body samples are adequate for analysis |
|
2 |
Above + previous months Impact (INA)
= Impact Above + Reference (TSA) + Reference
(TSB) = Reference |
Proceed to step 3 unless Proceed to step 2 unless tissue and whole body samples are adequate for analysis |
|
3 |
Above + previous months Impact (INB)
= Impact Above + previous months Reference
(TNA) = Reference |
Proceed to step 4 unless Proceed to step 2 unless tissue and whole body samples are adequate for analysis |
|
4 |
Above + previous months Reference
(TSB) = Reference |
Proceed to step 5 unless Proceed to step 2 unless tissue and whole body samples
are adequate for analysis |
|
5 |
Above + Reference (TSA) and
Reference (TSB) = Reference |
N/A |
(1) Note that
inter-seasonal pooling is not permitted
The pooling of Reference
and Impact biota is not permitted. Pooling
biota from station in the same area should only be done as a last measure.
Wherever possible, samples
from the same station and of the same species should be pooled together ie pooling together Species X from TNA Trawl 1 January 2012
with TNA Trawl 2 January 2012 would be preferable to pooling samples from TNA
and TNB, this can sometimes be unavoidable due to low catch rates. Pooling of totally different taxa is not
permitted, however, similar taxa can sometimes be
pooled when using ��Alternative Species��.
If insufficient material is
obtained following pooling then, material should be kept and used in
��Alternative Species�� pooling if they are of a similar group (e.g. if not
enough Charybdis cruciata
are available after the pooling of stations it is possible to pool with other Charybdis sp.). Contaminant uptake is dependent on the
salinity of the water, which is seasonal.
Typically greater uptake occurs during the wet season when salinity is
lower than in the dry season ([21]). For this reason, the pooling of samples
between different seasons should not be conducted.
6.7.2
Trawling,
Sorting & Analysis
Catches from the trawl
vessel should be processed to record the abundance and biomass of individuals
of commercial fisheries resources as well as the number of species (or to the
lowest possible taxonomic level) present.
6.8
Sampling Procedure and
Equipment
Trawl sampling should be
conducted during daytime (0600 �V 1800 hours) by a shrimp trawler equipped with
a GPS system to ensure accurate positioning of each trawl. Five replicate trawls, with six nets
deployed in each, should be conducted for 10 minutes at a trawl speed of about 5
km/hr at each station. If more than one of the six nets are retrieved in a damaged condition, the samples should be
rejected and the trawl repeated. To
ensure the quality of the benthic trawl samples, several control measures have
been incorporated into the sampling programme, including:
�P
no
more than three consecutive trawls should be conducted at a station and
resampling should only occur after a minimum of two hours has elapsed;
�P
subsequent
trawls at each station should be shifted (e.g. by ~ 500 m) to avoid repetitive
sampling over the same area of seabed; and,
�P
the first station sampled in each survey
should be selected at random to minimise the diurnal influences on catches.
Catches from all six nets
in each trawl should be combined to form one sample. Each sample should be immediately washed
and stored in sterilised (with hexane) glass jars. All samples should be chilled to 4 �XC and transported to the
laboratory for further sorting and analysis.
7
Human Health and Ecological
Risk Assessment
7.1
Introduction
The waters north of Lantau have historically been important fishing grounds. These fishermen's catches comprise
mainly shrimps and crabs, as well as fish species of relatively low commercial
value such as pony fish, puffer fish and gobies ([22]). The North of Lantau
area also is recognized as the primary habitat of the Indo-Pacific Humpback
Dolphin (Sousa chinensis)
within
Backfilling operations at
the SB Facility will be designed to minimize the dispersion of contaminated
sediments during disposal and to prevent the long-term migration of
contaminants through placement of a clean sand and mud cap. However, as losses of contaminated
sediment will nevertheless occur during placement, and as the area serves as
habitat for marine species which may be consumed by humans and/or the
Indo-Pacific Humpback Dolphin, the risk of adverse impacts must be addressed by
the monitoring programme. Pathways
of contaminant release to sensitive receivers (ie
humans and dolphins) include ingestion of contaminated sediment, ingestion of
dissolved and suspended contaminants in water, and ingestion of organisms with
contaminant residues.
Consequently, a risk
assessment will be performed on an annual basis to verify that no unacceptable
risk are occurring to either human health or marine mammals as a result of
consuming prey species from the waters in the vicinity of the pits of North Lantau. The
details of the EM&A programme for assessing hazard to health of humans and
marine mammals are presented below.
7.2
Objective
The objective of the risk
assessment component of the monitoring programme is to determine whether backfilling
operations at the active pits are posing an unacceptable risk to humans and
dolphins through consumption of seafood/marine prey species from the
7.3
Hypothesis
Given the above discussion
of objectives, the impact hypotheses for this component of the monitoring
programme are defined as follows:
For
Human Health
IH1:
Risks to human health from
consumption of commercial species captured adjacent to the active pits are no
greater than risks associated with consumption of species remote from the
active pits;
AND
IH2:
Risks to human health from consumption
of commercial species captured adjacent to the active pits are below the
screening risk criterion (see Section 7.5).
For Dolphins
IH1: Risks to dolphins from consumption of prey species captured
adjacent to the active pits are no greater than risks associated with
consumption of prey species remote from the active pits;
AND
IH2: Risks to dolphins from consumption of prey species captured
adjacent to the active pits are below the screening risk criterion (see Section 7.5).
7.4
Sampling Design
Data required for the risk
assessment should consist of:
�P
contaminant
concentrations in commercial/prey species collected from stations adjacent to
and remote from the active pits;
�P
toxicology
data for humans and dolphins;
�P
literature-derived
human consumption rates and patterns for seafood;
�P
literature-derived
data on exposure of humans from other food groups;
�P
literature-derived
data on contaminant levels in marine mammals;
�P
data
collected by AFCD on contaminant levels in stranded Sousa chinensis carcasses; and,
�P
existing natural history
information for the Indo-Pacific Humpback Dolphin and related species (eg diet composition and feeding range).
The primary data input to
the risk assessment should derive from the biannual trawl (ie
tissue samples for human populations and whole body samples for dolphins)
monitoring events (Section 6). The risk assessment will be performed on
an annual basis.
7.5
Use of Data
The risk assessment will
follow the guidelines of the US Environmental Protection Agency ([23]) ([24])
and will
incorporate a four-step approach involving problem formulation, estimation of
exposure, characterization of ecological or human health effects (injury), and
risk characterization. Each of
these steps is described below with reference to how each applies to both human
health and ecological risk assessment.
Problem
Formulation:
Also known as hazard definition ([25]), the problem formulation
will describe the sensitive populations (eg the
general Hong Kong population, subsistence fishermen, the Indo-Pacific Humpback
Dolphin) and identify biological effects of concern potentially associated with
the backfilling operations at the active facility. Identification of these effects should
include a discussion of contaminants of concern, measurement endpoints and a
conceptual model embodying the mechanisms of contaminant migration.
Estimation
of Exposure:
The purpose of the exposure estimation is to determine the intake of each
contaminant of concern by potentially exposed individuals. This step will consider the various
routes of contaminant release and their migration from the site to sensitive
receivers. Factors such as fate and
transport processes, the concentrations in the ambient environment, and the
maximum short-term or average lifetime doses should be assessed.
For
human populations exposure factors presented in previous reports (1) (2)
will be critically evaluated to determine if further modification is necessary. These factors, which include amounts of
seafood consumed, origin of seafood products, and methods of preparation (eg raw versus cooked, whole body vs
tissue only) will be evaluated for the general population and any sensitive sub-populations
(eg subsistence fishermen fishing in the SB area).
Characterization
of Effects:
The effects assessment is designed to quantify the relationship between the degree
of exposure to a substance and the extent of toxic injury or disease. This step in the assessment will use
data derived from dose response studies on laboratory animals or, less
frequently, on exposed human populations and clinical trials. For non-carcinogenic substances, once
the relationship between doses and responses is established, a threshold which
represents the highest contaminant concentration that is not expected to result
in an adverse effect, ie the reference dose (RfD) or a No Observed Adverse
Effect Level (NOAEL) can be established.
This threshold will then compare to the dose derived from the exposure
assessment above to produce the risk characterization.
For humans, dose-response
relationships must be considered separately for carcinogens and non-carcinogens. When dealing with carcinogens, a cancer
potency factor (CPF) or Slope Factor (SF) for each contaminant of concern will
be used. For non-carcinogens, the
NOAEL or LOAEL (lowest observed adverse effect level) will be used as the
threshold value. Data on CPFs and
NOAEL/LOAEL values are available through the
Risk
Characterization:
The risk characterization will integrate the results of the exposure and
effects assessments to estimate the risks and consequences of contaminant
exposures. In this step, the
estimated exposure should be divided by the threshold value to obtain a Hazard
Quotient (HQ). Generally HQ values
below 1 are considered to represent a very low risk of adverse effects, whereas
HQ values above 10 indicate a moderate to high level of risk.
For human populations, the
general approach to evaluating HQs can be applied to this Project. However, the human health risk
characterization produced for this Project should be updated through the use of
continually collected tissue and other environmental monitoring data to reflect
current conditions. This Study's
human health risk assessment will improve the robustness of previous studies
through a careful reconsideration of all exposure and effects parameters, with
particular focus on background doses and seafood consumption patterns.
8
Benthic Recolonisation
8.1
Introduction
The EIA conducted for the
SB Facility has indicated that benthic fauna are expected to recolonise the pits following capping with uncontaminated
mud. It is expected that recolonisation of the natural benthic assemblage will occur
and eventually the benthic assemblage will resemble that of the surrounding
areas. Recolonisation
may be achieved by larval recruitment, influx of juveniles or adults carried in
water currents, or through the active swimming or crawling of individuals. However, other natural (eg storm events, hypoxia, salinity fluctuations) or
anthropogenic (eg pollution, dredging activities and
fisheries operations) activities may hinder recolonisation
of capped pits. As a result, the
factors contributing to the composition of the benthic assemblage may be
difficult to determine. It is also
important for any recolonisation studies to be aware
of any cap maintenance (or "topping up") activities which may also
impact the resident benthic assemblages.
In order to verify the recolonisation of marine biota on the capped pits, a
benthic recolonisation programme is recommended. The full details of the EM&A
programme for benthic recolonisation are presented in
the following sections.
8.2
Objective
The objective for this
component of the EM&A is to monitor and report on the benthic recolonisation of the capped pits including the previous
ones and specifically to determine the difference in infauna
between the capped pits and adjacent sites.
8.3
Hypothesis
The impact hypothesis for
this task is as follows:
Recolonisation
is occurring at the capped pits such that assemblages at the capped pits become
more similar to reference assemblages as time since capping increases.
The null hypothesis to be
tested for this work component is as follows:
H0
There is no difference in
the structure of benthic infaunal assemblages found
at the capped pits at the active facility and adjacent reference areas.
H0 Similarity of assemblage
structures between impact and reference stations does not change over time.
8.4
Sampling Design
The sampling design of this
task involves two treatments: capped pits and reference areas. The capped pit treatment will involve
collection of samples from the capped mud pits at the active facility. The second treatment will involve
sampling at different reference sites, which are chosen to improve the balanced
nature of the design. Using
multiple controls is an effective way of ensuring that the extremely variable
nature of
The benthic sediment
samples collected during this task will be analysed for the following
parameters:
�P
Percentage
of silt/clay in the sediments;
�P
Faunal
Abundance;
�P
Faunal
Biomass;
�P
Species
Composition; and,
�P
Trophic
Structure
The locations of impact and
reference stations for the SB facility are shown in Figure 8.1
and the coordinates are shown Table 8.1. For standardisation purposes, the
reference stations are at the same locations as existing monitoring programmes
for ESC facilities. Samples will be
collected twice per year, once in the dry season, once during the wet
season. Twelve replicate samples
will be collected from each of the monitoring stations. Sampling will commence once capping of
all pits is completed, as detailed in the Sampling
Programme in Annex C.
The sampling frequency and
number of replicates are the same as those currently proposed for the CMP IV/ V
EM&A programmes and will initially be used for SB monitoring as a
consistent and conservative approach.
These will be reviewed and adjusted accordingly based on power analyses
in each Annual Review Report.
Table 8.1 Coordinates of Benthic
Monitoring Stations at South Brothers Facility
|
Station |
Easting |
Northing |
|
Reference |
|
|
|
RBA |
806399 |
821682 |
|
RBB |
808206 |
822708 |
|
RBC |
806171 |
819354 |
|
Capped Pit |
|
|
|
SB-CPA |
815231 |
819548 |
|
SB-CPB |
814808 |
819098 |
Note: Coordinates are based
on
8.5
Statistical Treatment of Data
The data collected during
the monitoring programme will be analysed using two different but complementary
approaches as detailed below.
8.6
Use of Data
ANOVA & MANOVA: Simple,
univariate measures will be tested using an Analysis
of Variance (ANOVA), and multivariate measures of community structure will be
tested using the Multiple Analysis of Variance (MANOVA). Both ANOVA and MANOVA test the same null
hypothesis using similar methods. The
method is essentially a comparison of the variability within a site to the
variability between sites. If the
ratio of these two variances (that is, the between-group-variance over the
within-group-variance) is large enough, then any differences observed are due
to true differences that exist between the groups and not just to random variation.
ANOVA and MANOVA tests are based on several assumptions related to the
underlying distribution of the data being analysed (ie
normality, homogeneity of variances).
If the data deviate significantly from these assumptions, then these
tests are considered to be inappropriate.
If this situation arises, alternative procedures (ie
parametric tests with rank transformed data or non-parametric analogues such as
Kruskal Wallis) which address similar hypotheses but
do not require such stringent assumptions will be adopted. Observed differences between the sites
and/or areas will be tested using multiple comparison procedures such as the
Student Newman Keuls (SNK) or Tukey
test.
8.6.1
Multivariate
Analyses
Non-metric
Multi-dimensional Scaling (MDS): Multi-dimensional Scaling (MDS) will also be used to
depict the similarities between stations based on their benthic assemblages. MDS is a method for creating a low
dimensional picture of the relationships between stations in a complex, multi-dimensional
problem. The Bray-Curtis distance matrices
will be used for both the clustering techniques and the MDS. The dendrogram
from the cluster analysis and the MDS ordination plot will provide
complementary views of the same similarity information. The data for MDS and cluster analyses
should be standardised prior to analysis, to ensure that bias resulting from
including data in different forms (eg percent data for silt clay composition, numerical data for
abundances and biomass data in mg) does not occur.
8.7
Use of Data
The detailed statistical
analyses described above will be used to comprehensively explore the benthic
assemblage patterns in the area of the active pits. This exploration should lead to
conclusions regarding the effectiveness of the cap material in promoting
post-dredging benthic assemblages.
8.7.1
Sampling
Procedure and Equipment
The sampling team and
vessel will be deployed and accurate positioning attained as described in Section 4. The vessel will be equipped with
adequate fixed sieve stations to facilitate rapid processing of samples and
ensure the required number of samples are collected in
each survey. At each of the
designated benthic sampling stations, seabed sampling will be carried out with
a modified Van Veen grab sampler (dimensions 30 cm H
30 cm H 15 cm D) or similar instrument approved by EPD/AFCD. One subsample of approximately 1 kg
sediment will be collected from each sample for analysis of particle size. The remaining sediment from each sample
will be used for sorting. Samples
will be labelled and sieved through a 1 mm and 0.5 mm sieve and all residues
and organisms retained, double-bagged and preserved in 4% buffered formalin in
seawater. A vital stain (eg Rose bengal)
will be added to distinguish organic materials and organisms from other
non-living residues. The grab and
utensils will be washed thoroughly with seawater after each deployment to avoid
cross-contamination between samples.
On completion of the survey all samples will be transferred to the
laboratory for sorting and identification.
All sediment sieving will be conducted by qualified marine scientists
who will oversee and coordinate all field operations.
8.7.2
Laboratory
Procedures
Upon
arrival at the laboratory, all benthic samples should be re-inventoried and
checked against chain-of-custody forms.
Sample rescreening should be performed after the samples have been held
in formalin for a minimum of 24 hours to ensure adequate fixation of the
organisms. Individual samples from
the 500 �gm and 1 mm2 mesh sieves will be
gently rinsed with fresh water into a 250 �gm sieve to
remove the formalin from the sediments.
Sieves will be partially filled while rinsing a specific sample to
maximize washing efficiency and prevent loss of material. All material retained on the 250 �gm sieve is placed in small fractions into a labelled petri
dish and preserved with 70% ethanol.
The material is lightly agitated to ensure complete mixing of the
alcohol with the sediments. The
sediment is then sorted to remove all animals and fragments. Original labels will remain with the
rescreened sample material.
Standard and accepted
techniques will be used for sorting organisms from the sediments ([28]). Small fractions of a sample will be
placed in a petri dish under a 10-power magnification dissecting microscope. The petri dish will be scanned
systematically and all animals and fragments removed using forceps. Each petri dish will be sorted at least
twice to ensure removal of all animals.
Organisms representing major taxonomic groups including Polychaeta, Arthropoda, Mollusca,
and miscellaneous taxa will be sorted into separate, labelled vials containing
70 percent ethanol. All sorted samples will be
systematically checked to ensure compliance with QA/QC program requirements
before proceeding to the taxonomic identification, enumeration, and biomass
determination phases of the analysis.
Taxonomic identifications
will be performed by regional taxonomic experts using stereo dissecting and
high-power compound microscopes, to the family level except for dominants,
which will be identified, where possible, to species. The careful sampling procedure employed
in the Study will minimise fragmentation of organisms, however should breakage
of soft-bodied organisms occur, only anterior portions
of organism fragments will be counted.
All fragments will be retained and weighed during biomass
determinations, described below. Rare
or questionable taxa will be compared against reference collection specimens
for confirmation and consistency of identification. The nomenclature used in all reference
collections referred to in this study should be cross checked and differences
or discrepancies should be noted. Biomass
determinations will be made by taking the blotted wet mass of each taxonomic
fraction.
8.8
Benthic Micro-Infauna
and Taxonomic Identification
Sorting QA/QC will be
performed using 25-power magnification by someone other than the original
sorter. Twenty percent
of each sorted sample should be resorted to ensure 95 percent
sorting efficiency. A sample passes
QA/QC if the number of organisms found during the QA/QC check does not
represent more than 5 percent of the total number of
organisms found in the entire sample.
If the number of organisms found is greater than 5 percent
of the total number, the entire sample will be resorted. Any samples where the identification of
taxa is questionable will be sent out for independent re-identification by a
qualified regional expert. Reference
collections developed during previous seabed and benthic studies in
9
Impacts of Major Storms
9.1
Introduction
Based on the previous
experience with the development and approval for CMPs at East of Sha Chau for use as a contained
aquatic disposal for contaminated sediment, monitoring of the dispersion of
uncapped sediments during major storm events, such as typhoons of signal 8 or
higher, is an important objective of this EM&A programme. It is therefore considered necessary to
include this post-storm monitoring as part of the EM&A programme when the
SB Facility is active for backfilling operations.
9.2
Sampling Design
The post-storm monitoring
programme will mobilise within one week of a major storm event (Typhoon Signal
Number 8 or above) in order to determine whether the pits retain disposed
sediments during storms and whether there are any detectable changes in
sediment quality adjacent to the pits.
Sediment samples will be collected within one week of a major storm at
stations of the Cumulative Impact Monitoring
of Sediment Quality programme (Figure 4.2; Section 4.4.3). Only inorganic contaminants and particle
size distribution (organic contaminants are not measured as inorganics can
provide a more cost-effective indicator of any sediment quality change) will be
analysed in the storm assessment.
The field, laboratory and
QA/QC procedures for sediment sample collection after major storm events will
be identical to those used for the Cumulative
Impact Monitoring of Sediment Quality Programme (Section 4).
10
Reporting
10.1
General
Reports will be provided in
both hard copy and electronic version upon agreeing the format with EPD. This would enable a transition from a
paper/historic and reactive approach to an electronic/real time proactive
approach.
10.2
Reports
The following documents
will be submitted as part of the EM&A programme:
�P
Environmental
Monitoring and Audit Manual;
�P
Reports
on Dredging and Capping Operations;
�P
Monthly
EM&A Reports;
�P
Quarterly
EM&A Reports;
�P
Annual
Review Report;
�P
Annual
Risk Assessment Report;
�P
Draft
Final EM&A Report;
�P
Executive
Summary Report; and
�P
Final
EM&A Report.
Monthly EM&A
Reports
will be required for the duration of the programme period and will be submitted
to CEDD by the 10th working day of each month. Each report will typically contain:
�P
a
list of the activities, tests, analyses and assessments performed in the month
according to that detailed in the Environmental Monitoring and Audit Manual for
the purpose of reporting any significant findings resulting from monitoring and
audit activities;
�P
a
list of outstanding activities, tests, analyses and assessments as well as the
schedule for completing these outstanding items; and,
�P
a list of previously outstanding
activities, tests, analyses and assessments that are completed in the month.
Quarterly
EM&A Reports
will be required for the duration of the programme period and will be submitted
within 30 days from the end of every quarterly monitoring period. Each report will:
�P
confirm that all activities, tests, analyses,
assessments etc. have been carried
out as stated in this EM&A Manual;
�P
report
on the auditor's findings on the field events and laboratory tests and
analysis;
�P
report on any trends resulting from
disposal, dredging and capping activities at the active facility.
An Annual Review Report will be submitted within 60 days from the end
of every yearly monitoring period. Each
report will:
�P
make
a clear statement on the acceptability of environmental impacts by reference to
the impact hypotheses;
�P
state
how successful the monitoring programme has been in addressing the objectives
of the Assignment;
�P
make
recommendations for revisions to the monitoring programme and disposal
operation, as necessary, to ensure that the objectives are fully met in a cost
effective manner; and
�P
summarise the monitoring results to
illustrate whether any change or trend resulting from the disposal, dredging
and capping activities is detected or not.
A Risk
Assessment Report
will be prepared within 60 days from the end of every yearly monitoring period. Each report will address the risk to the
human health and dolphin of eating seafood taken in the marine area around
A Draft Final
EM&A Report
will be prepared within 90 days from the end of the monitoring period for this EM&A
programme. It will address how each
objective of the EM&A programme has been met and should will include a
final version of the EM&A Manual as an appendix.
A Final EM&A
Report
will be prepared within 3 weeks after the agreed revisions on the Draft Final
Report.
An English and Chinese Executive Summary Report will be
prepared within 3 weeks of receipt of comments on the Draft Final Report. It should highlight any issues of
concern and the acceptability of the operations at the SB facility.